Surrogate Insulin Resistance Indices as Markers of Lifetime Cardiovascular Disease Risk Across Obesity Phenotypes in Bangladeshi Adults: A Cross-sectional Study
Independent replication
Abstract
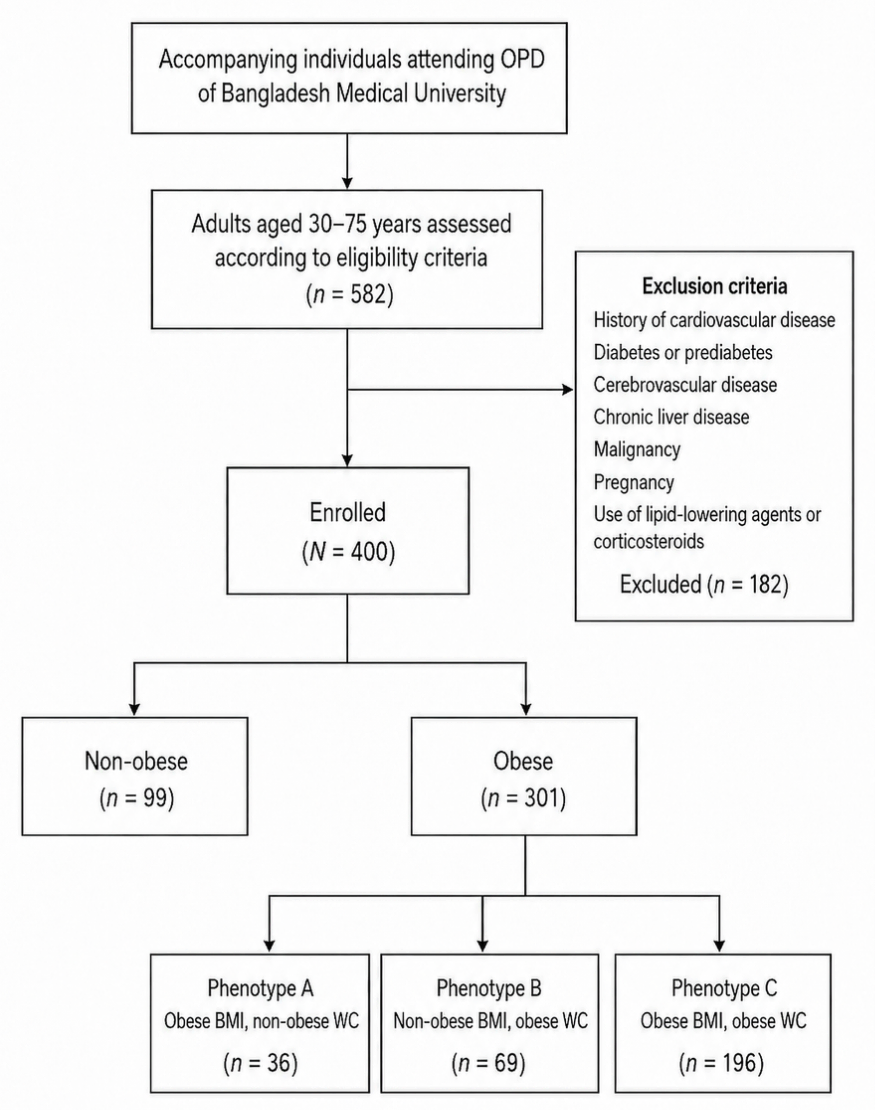
Background Obesity is a major independent risk factor for insulin resistance and cardiovascular disease (CVD). Combining BMI with waist circumference identifies distinct obesity phenotypes that may differ in insulin resistance and cardiovascular risk. The triglyceride-glucose (TyG) index and triglyceride-to-high-density lipoprotein cholesterol ratio (TG/HDL-C) are inexpensive surrogate markers of insulin resistance. However, their ability to identify lifetime CVD risk across obesity phenotypes has not been evaluated in Bangladeshi adults. Methods This cross-sectional study included 400 eligible adults from the outpatient department of Bangladesh Medical University between August 2022 and February 2023. Participants were initially classified as non-obese or obese. Then 301 obese participants were further categorized into phenotype A (obese BMI, non-obese WC), phenotype B (non-obese BMI, obese WC) and phenotype C (obese BMI and obese WC). The TyG index and TG/HDL-C ratio were calculated from fasting glucose and lipid profiles. Lifetime CVD risk was estimated using the QRISK lifetime CVD risk calculator. Group comparisons were performed using the Kruskal–Wallis test followed by Dunn–Bonferroni post hoc analysis. Multivariable logistic regression was used to determine the associations of the TyG index and TG/HDL-C ratio with lifetime CVD risk. Diagnostic performance was evaluated using ROC curve analysis. Results Surrogate insulin resistance indices and lifetime CVD risk were significantly higher in phenotype C compared with phenotype A. The TyG index [aOR 16.64, 95% CI 8.56–32.35] and TG/HDL-C ratio [aOR 1.72, 95% CI 1.52–1.94] were associated with elevated lifetime CVD risk. Phenotype-specific optimal cutoff values of TyG index to detect CVD risk were 8.81 (AUC = 0.773) for phenotype A, 9.04 (AUC = 0.789) for phenotype B and 9.15 (AUC = 0.819) for phenotype C. Correspondingly, optimal cutoff values of TG/HDL-C were 3.93 (AUC = 0.901), 4.72 (AUC = 0.830) and 4.94 (AUC = 0.877) for phenotype A, B and C respectively. Conclusions The TyG index and TG/HDL-C ratio demonstrated good discriminatory performance for identifying individuals at elevated lifetime CVD risk. Phenotype-specific cutoff values may improve individualized cardiovascular risk stratification after external validation, particularly in resource-limited settings such as Bangladesh. Clinical trial registration Not applicable.
From the paper
- Participants
This cross-sectional study included 400 eligible adults from the outpatient department of Bangladesh Medical University between August 2022 and February 2023.
- Result
The TyG index [aOR 16.64, 95% CI 8.56–32.35] and TG/HDL-C ratio [aOR 1.72, 95% CI 1.52–1.94] were associated with elevated lifetime CVD risk.
Quoted word for word from the full text on researchsquare.com.
- Insulin resistance
- Lifetime cardiovascular disease risk
- Cardiovascular disease
- Obesity
- Body mass index
- Humans
The paper
Sirajganj Medical College; Bangladesh Medical University
Research Square, 14 Oct 2026, Open access, Preprint, not peer-reviewed