Blood fat-and-sugar index linked to worsening health risks
The estimated relative rate of progression to high risk was 1.35 in the index’s highest third compared with its lowest third.
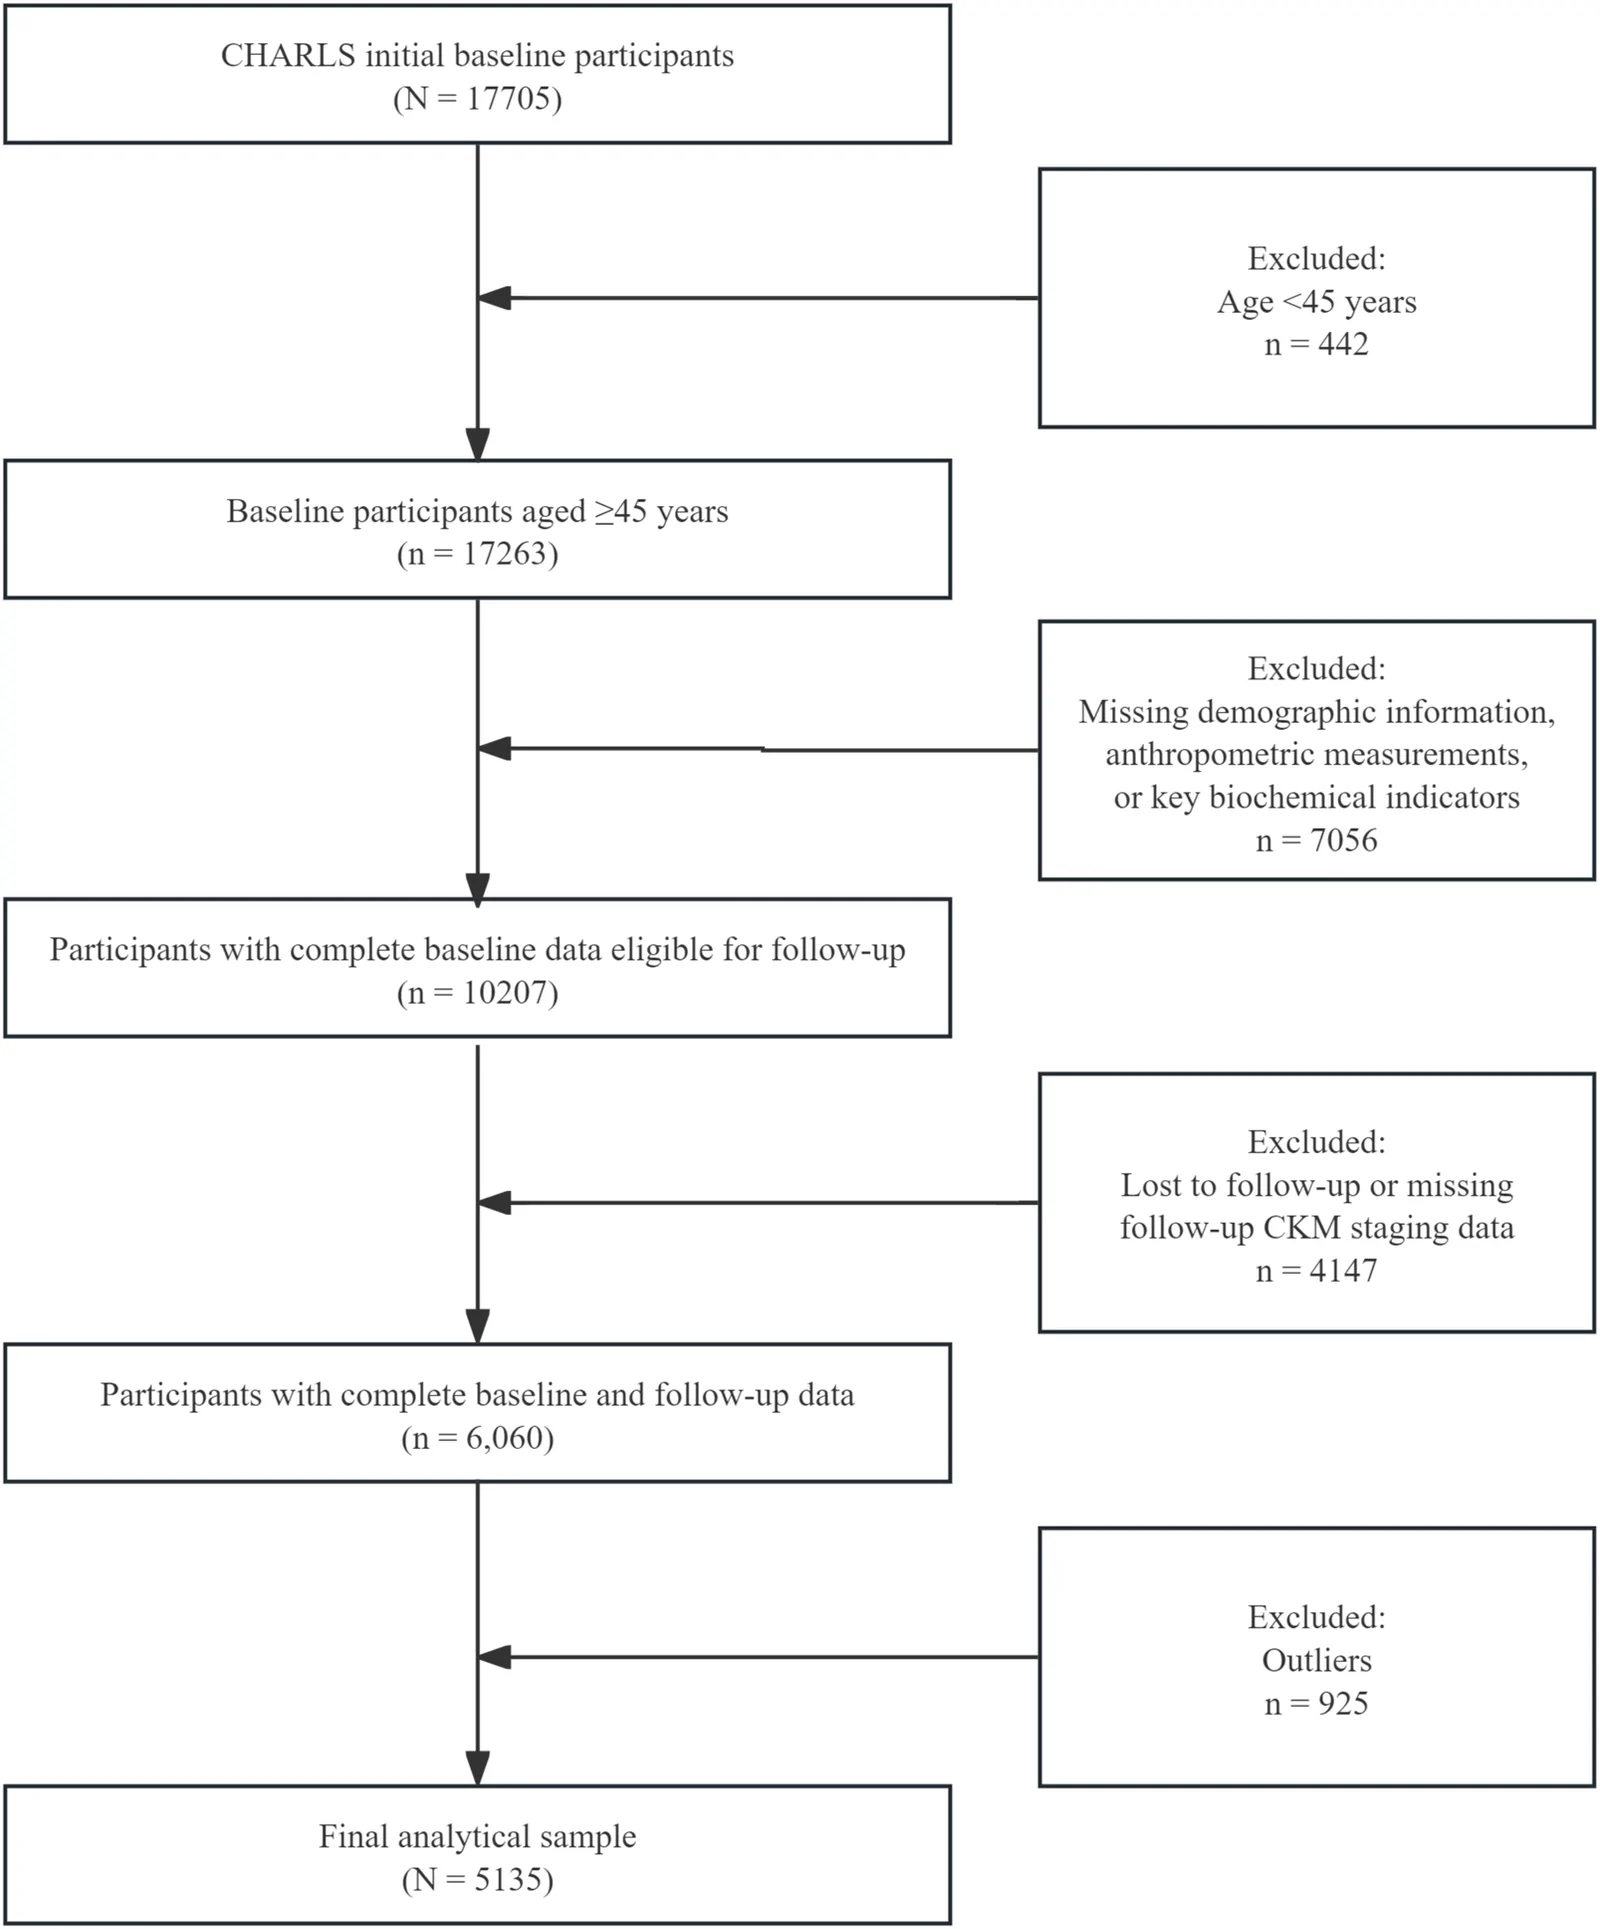
Researchers studied 5,135 middle-aged and older adults in an observational study of cardiovascular-kidney-metabolic syndrome. This syndrome links heart and kidney health with how the body processes energy. They used statistical models to estimate movement between five stages. They grouped stages 0–2 as low risk and stages 3–4 as high risk.
The triglyceride-glucose index combines levels of blood fats and blood sugar. Compared with the lowest third, the highest third had an estimated relative rate of 1.35 for moving from low to high risk. The index was not significantly associated with movement back to low risk. Earlier stages showed more movement in both directions. More advanced stages had longer expected stays.
Why it matters
The authors suggested that the index may provide additional information for identifying middle-aged and older adults at increased risk of progression across these linked health problems.
Caveats
This observational study cannot show that a higher index caused progression, or that lowering it would reduce risk.
From the paper
- Participants
A total of 5,135 participants were included in the study ( Table 1 ).
Results, 3.1 Baseline characteristics of the study population
- Result
After adjustment for prespecified covariates, the association between the T2 group and progression from the low-risk state to the high-risk state was not statistically significant compared with the T1 group (HR = 1.15, 95% CI: 0.96–1.37, P = 0.131).
- Limitation
Because this study was based on observational cohort data, residual confounding cannot be completely excluded despite adjustment for a range of demographic, lifestyle, and clinical factors.
Quoted word for word from the full text on frontiersin.org.
The paper
Chengdu Medical College
Frontiers in Medicine, 28 Sep 2026