Excess weight linked to tears in the body’s main artery
In the meta-analysis, each 0.1-unit higher waist-to-height ratio was linked to a relative risk of 1.32 for tears in the main artery’s inner wall.
Dose-response
Limit: The Japanese health-checkup cohort lacked physical activity and education data, leaving potential confounding
Edited by Boris Djordjevic · AgingResearch.News
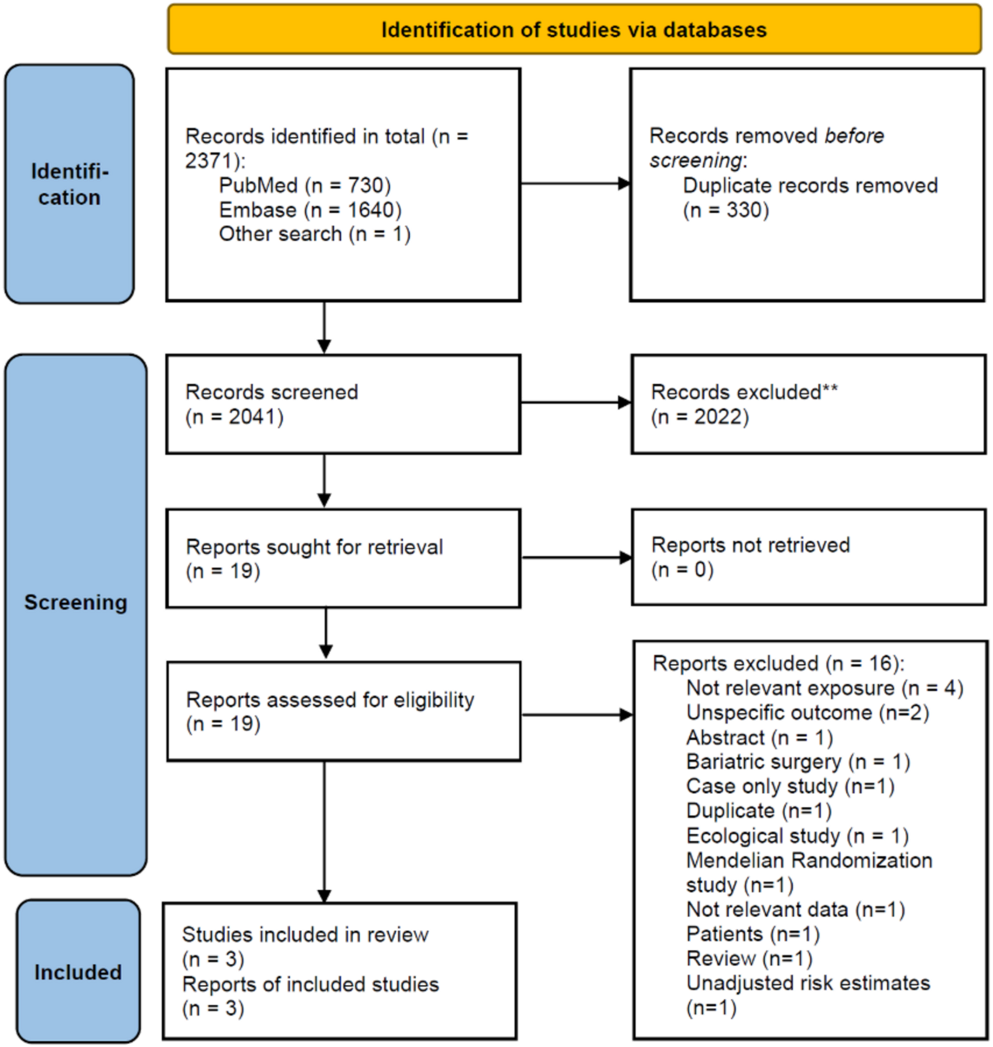
An observational analysis included 496,255 UK Biobank participants and 630,841 participants in the Japan Specific Health Checkups Study. Researchers also conducted a meta-analysis of five cohort studies on body mass index, a weight measure adjusted for height, covering 4,962,288 participants and 2,007 cases of aortic dissection—a tear in the inner wall of the body’s main artery.
The UK cohort recorded 371 dissections over 12.3 years; the Japanese cohort recorded 105 over four years. Higher body mass index, larger waists and higher waist-to-height ratios were associated with dissection risk in the UK and dissection mortality in Japan. Waist-to-height ratio means waist measurement divided by height. In the meta-analysis, each 10-centimeter higher waist circumference was associated with a relative risk of 1.21 for aortic dissection.
Why it matters
For efforts to maintain artery health as people age, the findings suggest avoiding excess weight may be relevant to preventing aortic dissection.
Caveats
These observational studies cannot show that excess weight caused dissection or that losing weight would prevent it. Only two studies contributed to each pooled analysis of waist size and waist-to-height ratio.
From the paper
- Participants
The meta-analysis of BMI included 2007 cases and 4,962,288 participants.
- Follow-up
… sensitivity analyses were conducted (1) by excluding the early follow-up period of 3 years, (2) by excluding participants with other prevalent diseases at baseline including ischemic heart disease (ICD-10: I20-I25) or stroke (ICD-10: I60, I61, I63, I64) …
- Result
The summary RR for high vs. low BMI was 1.47 (95% CI: 1.13–1.91, I = 0%, pheterogeneity=0.57, n = 5) (Supplemental Fig. 3) and per 5 kg/m increase in BMI was 1.09 (95% CI: 1.00–1.20, I = 43%, pheterogeneity=0.14, n = 5) (Fig. 2a).
Quoted word for word from the full text on link.springer.com.
The paper
Imperial College London
European Journal of Epidemiology, Oct 21, 2026