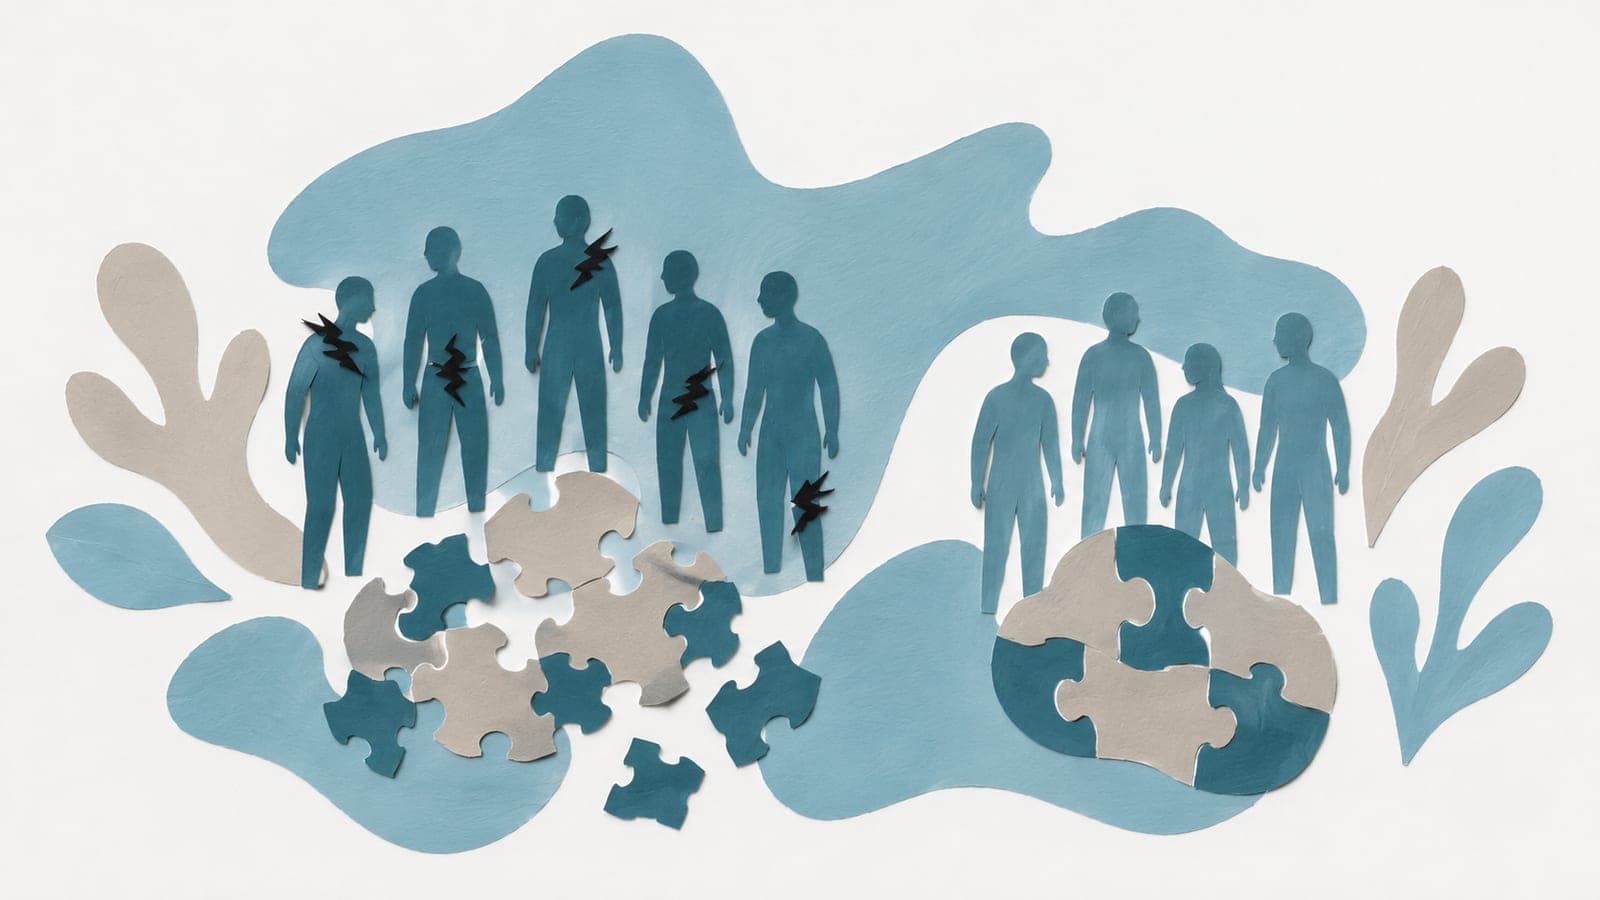
Late-life pain was more common where development ranked lowest
Any bodily pain in later life was 30.6 percentage points more common in countries with the lowest human development scores than in those with the highest.
Multicentre
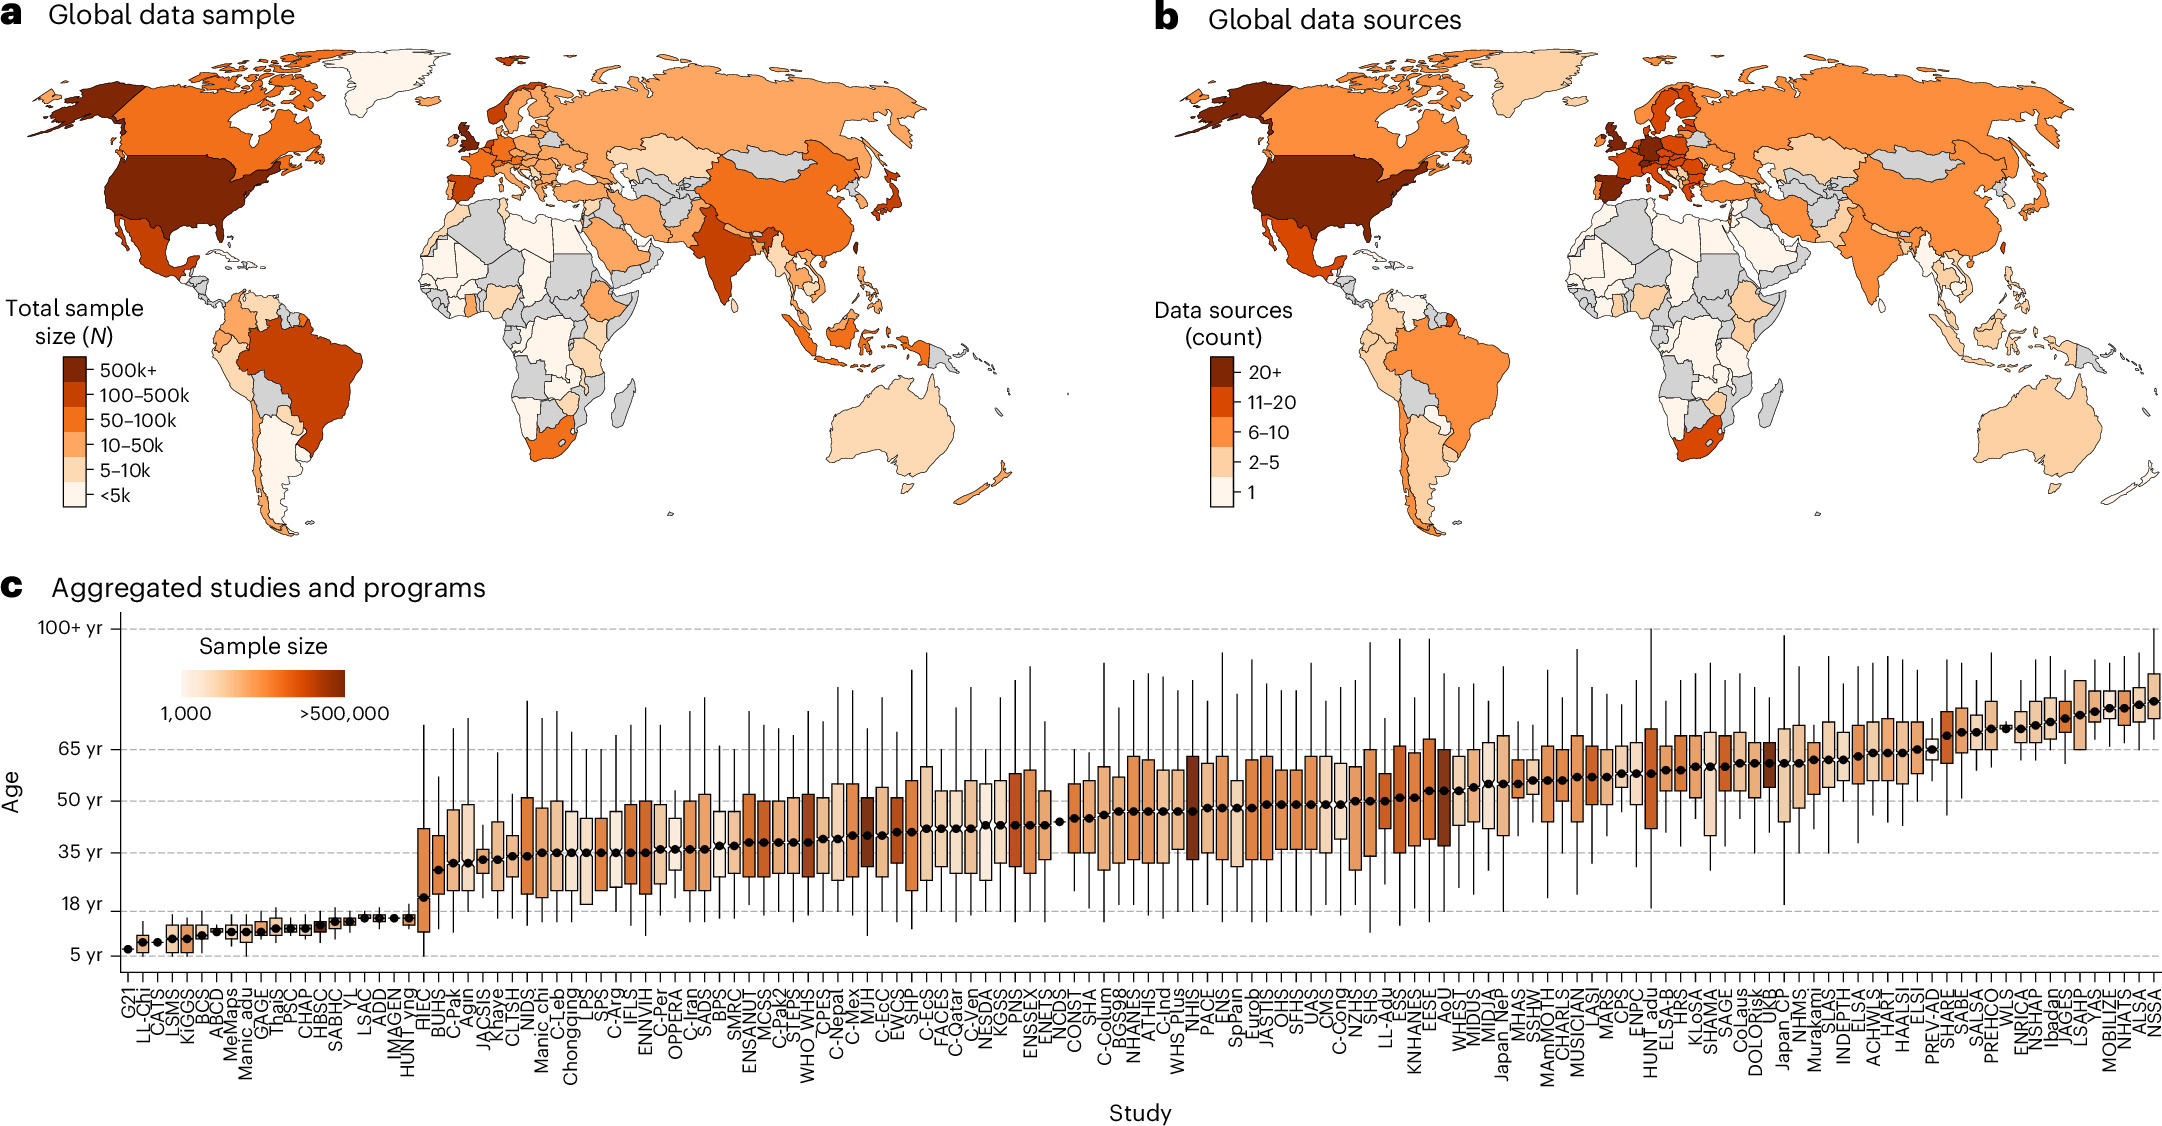
In an observational study of 6,125,459 participants in 118 countries, researchers combined self-reported pain data from 902 population-based sources. They created reference curves showing how common pain was at different ages and a freely accessible platform for comparing other datasets with these patterns.
Pain prevalence ranged from roughly 2% for facial pain to 40% for back pain. The share of people reporting pain rose most steeply before age 55. Women reported pain more often than men at all 11 body sites. In later life, any bodily pain was 30.6 percentage points more common in countries with the lowest Human Development Index scores than in those with the highest. This index measures health, education and income.
Why it matters
Pain is the leading cause of disability worldwide, making its distribution in later life important for understanding older people’s health. The reference framework could inform more equitable monitoring and prevention.
Caveats
The analysis relied on self-reported pain. Its observational design could not establish why pain patterns differed between countries.
From the paper
- Participants
We analyzed a total of 6,125,459 participants across 902 data sources from 138 population-based study programs, spanning 118 countries and territories (Fig. 1a).
- Result
… with the largest sex differences observed for facial (RR = 1.83 (95% confidence interval (CI): 1.79−1.88)), headache (RR = 1.74 (95% CI: 1.73−1.75)) and stomach/abdominal (RR = 1.60 (95% CI: 1.59−1.62)) pain.
- Absolute difference
… people in low-HDI settings experienced a substantially higher prevalence than in high-HDI settings (any bodily pain: risk difference: 30.6 percentage points (95% CI: 26.9−34.3); joint pain: 21.0 percentage points (95% CI: 20.2−21.8); back pain: 20.2 percentage points (95% CI: 19.6–20.9)).
- Limitation
Most contributing datasets were cross-sectional, so the trajectories describe population age patterns rather than within-person change.
Quoted word for word from the full text on nature.com.