Higher vulnerability scores linked to lung disease in China
Over an average 7.6 years, chronic lung disease occurred in 25.24% of those scoring three or more, compared with 8.55% scoring zero.
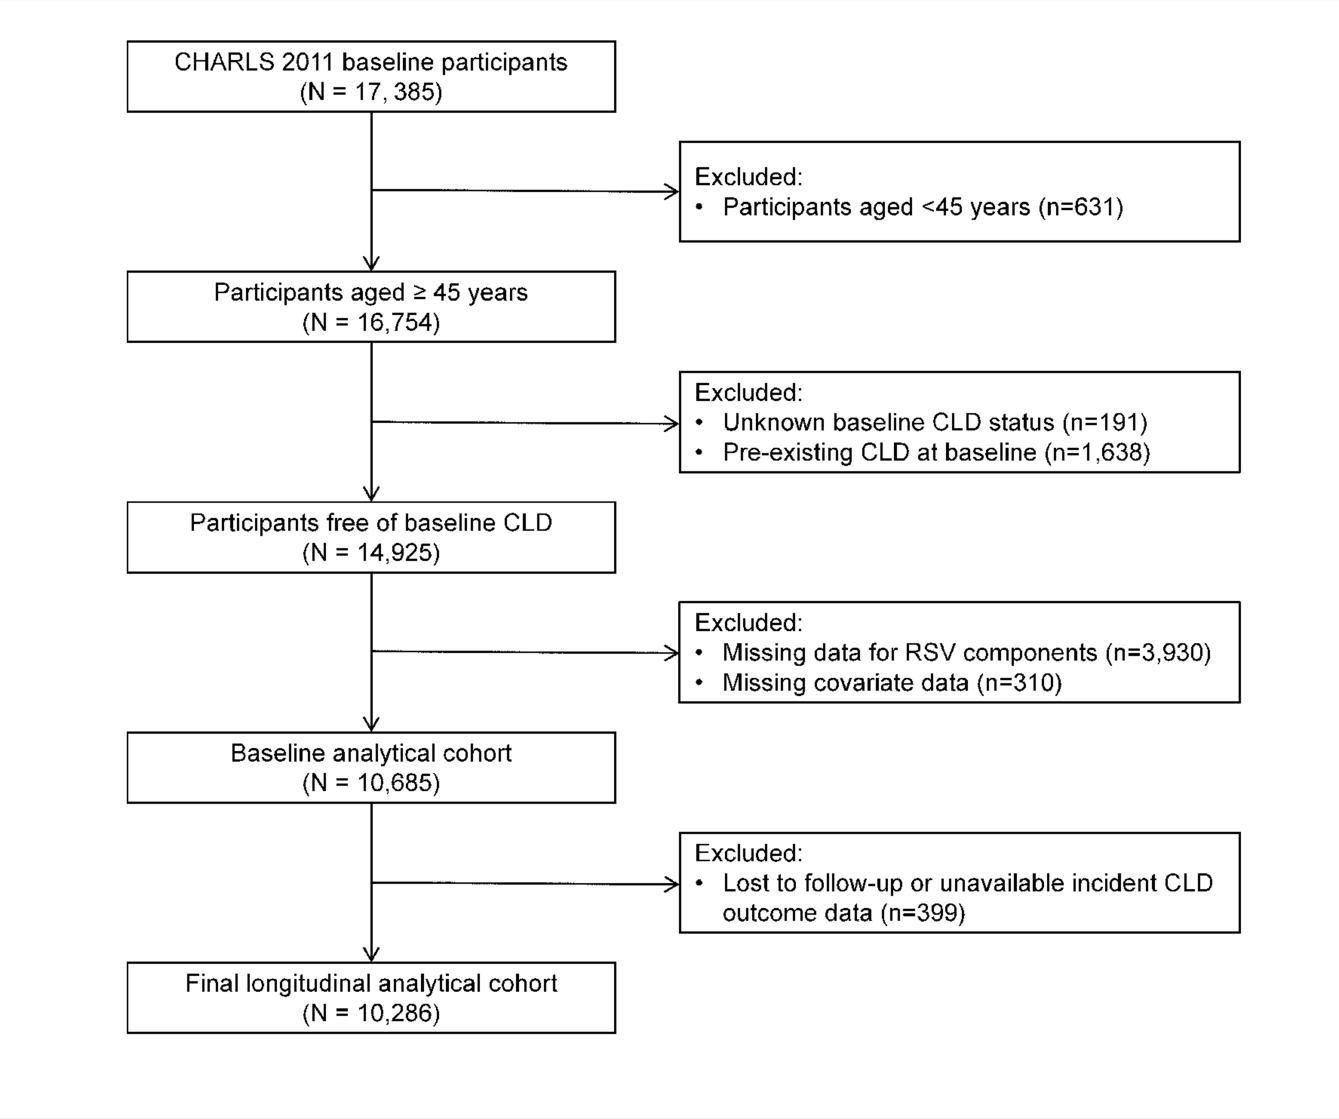
10,685 participants, dose-response
Limit: Undiagnosed baseline lung disease could lower peak flow, making apparent prediction reflect existing disease
An observational cohort study followed 10,286 adults aged 45 or older in China who had no chronic lung disease at the start. Researchers built a respiratory vulnerability score using a measure of how fast participants could breathe out, grip strength and current smoking. The score also included heart disease, kidney disease and depressive symptoms.
Researchers recorded 1,547 new cases of chronic lung disease during follow-up through 2020, which averaged 7.6 years. Disease risk rose progressively across the four score groups. After accounting for other factors, each one-point increase in the score was associated with a 34% higher relative risk of developing chronic lung disease.
Why it matters
Combining breathing measures with wider health measures may help identify middle-aged and older adults more susceptible to chronic lung disease, supporting early risk assessment.
Caveats
This observational study cannot show that higher scores caused lung disease. The preprint has not been peer-reviewed, and its findings may not apply to people under 45, outside China or already living with chronic lung disease.
From the paper
- Participants
A total of 10,685 participants were included in the baseline analysis and 10,286 participants were included in the longitudinal analysis.
- Result
In the fully adjusted model, compared with participants with RSV = 0, those with RSV = 1, RSV = 2, and RSV ≥ 3 had significantly higher risks of incident CLD (HR 1.54, 95% CI 1.30–1.82; HR 1.97, 95% CI 1.66–2.34; and HR 2.83, 95% CI 2.35–3.41, respectively; all P < 0.001).
- Events by group
The cumulative incidence of CLD increased progressively across RSV categories, from 8.55% in the RSV = 0 group to 13.47%, 17.58%, and 25.24% in the RSV = 1, RSV = 2, and RSV ≥ 3 groups, respectively (P < 0.001).
Quoted word for word from the full text on researchsquare.com.
The paper
Nanchang University; China-Japan Friendship Hospital
Research Square, 14 Oct 2026, Open access, Preprint, not peer-reviewed