Acute and Chronic Resistance Training Differentially Modulate Myocardial Angiogenesis-Related Gene Expression in Wistar Rats
Randomized
Abstract
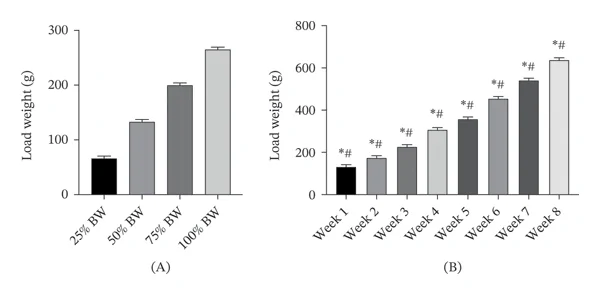
Myocardial angiogenesis contributes to the maintenance of myocardial perfusion and cardiac function. Resistance training (RT) induces cardiovascular adaptations, but the myocardial transcriptional responses to acute RT (ART) and chronic RT (CRT) remain incompletely understood. This study compared the expression of angiogenesis- and metabolic adaptation-related genes in the left ventricle following a single RT bout and 8 weeks of repeated RT in healthy male Wistar rats. Twenty-four rats were randomized to three groups: sedentary control (CON) (n = 8), ART (one ladder-climbing session), or CRT (ladder-climbing 5 days/week for 8 weeks). RT was performed on a 1-m ladder inclined at 80° using progressive loads attached to the tail. Left-ventricular tissue was collected 1 h after the exercise bout in ART and 1 h after the final training session in CRT. Compared to CON, ART showed significantly higher HIF-1α and FSTL1 expression, whereas PGC-1α and VEGF did not differ significantly. CRT also showed significantly higher HIF-1α and FSTL1 expression than CON, together with significantly higher PGC-1α and VEGF expression. No significant differences were observed between ART and CRT for any of the genes examined. These findings demonstrate distinct myocardial transcriptional profiles following ART versus CRT, characterized by an HIF-1α- and FSTL1-associated response after a single bout and a PGC-1α- and VEGF-associated response following CRT.
From the paper
- Result
PGC-1α expression also differed significantly among groups (F(2,21) = 4.632, p < 0.05, η = 0.306, 95% CI: 0.004–0.516), with significantly higher expression in the CRT group than in the CON group (mean difference = 1.526, 95% CI: 0.2130–2.8395, p < 0.05) …
Results, 3.3. Impact of RT on Cardiac Angiogenesis–Related Genes
- Limitation
First, the study assessed mRNA expression without corresponding protein-level measurements; therefore, changes in transcript abundance cannot be assumed to represent changes in protein activity or downstream signaling.
Quoted word for word from the full text on onlinelibrary.wiley.com.
The paper
Padjadjaran University
Cardiology Research and Practice, Oct 18, 2026, Open access