Dietary diversity and type 2 diabetes risk: evidence from a prospective Korean cohort study
Dose-response
Abstract
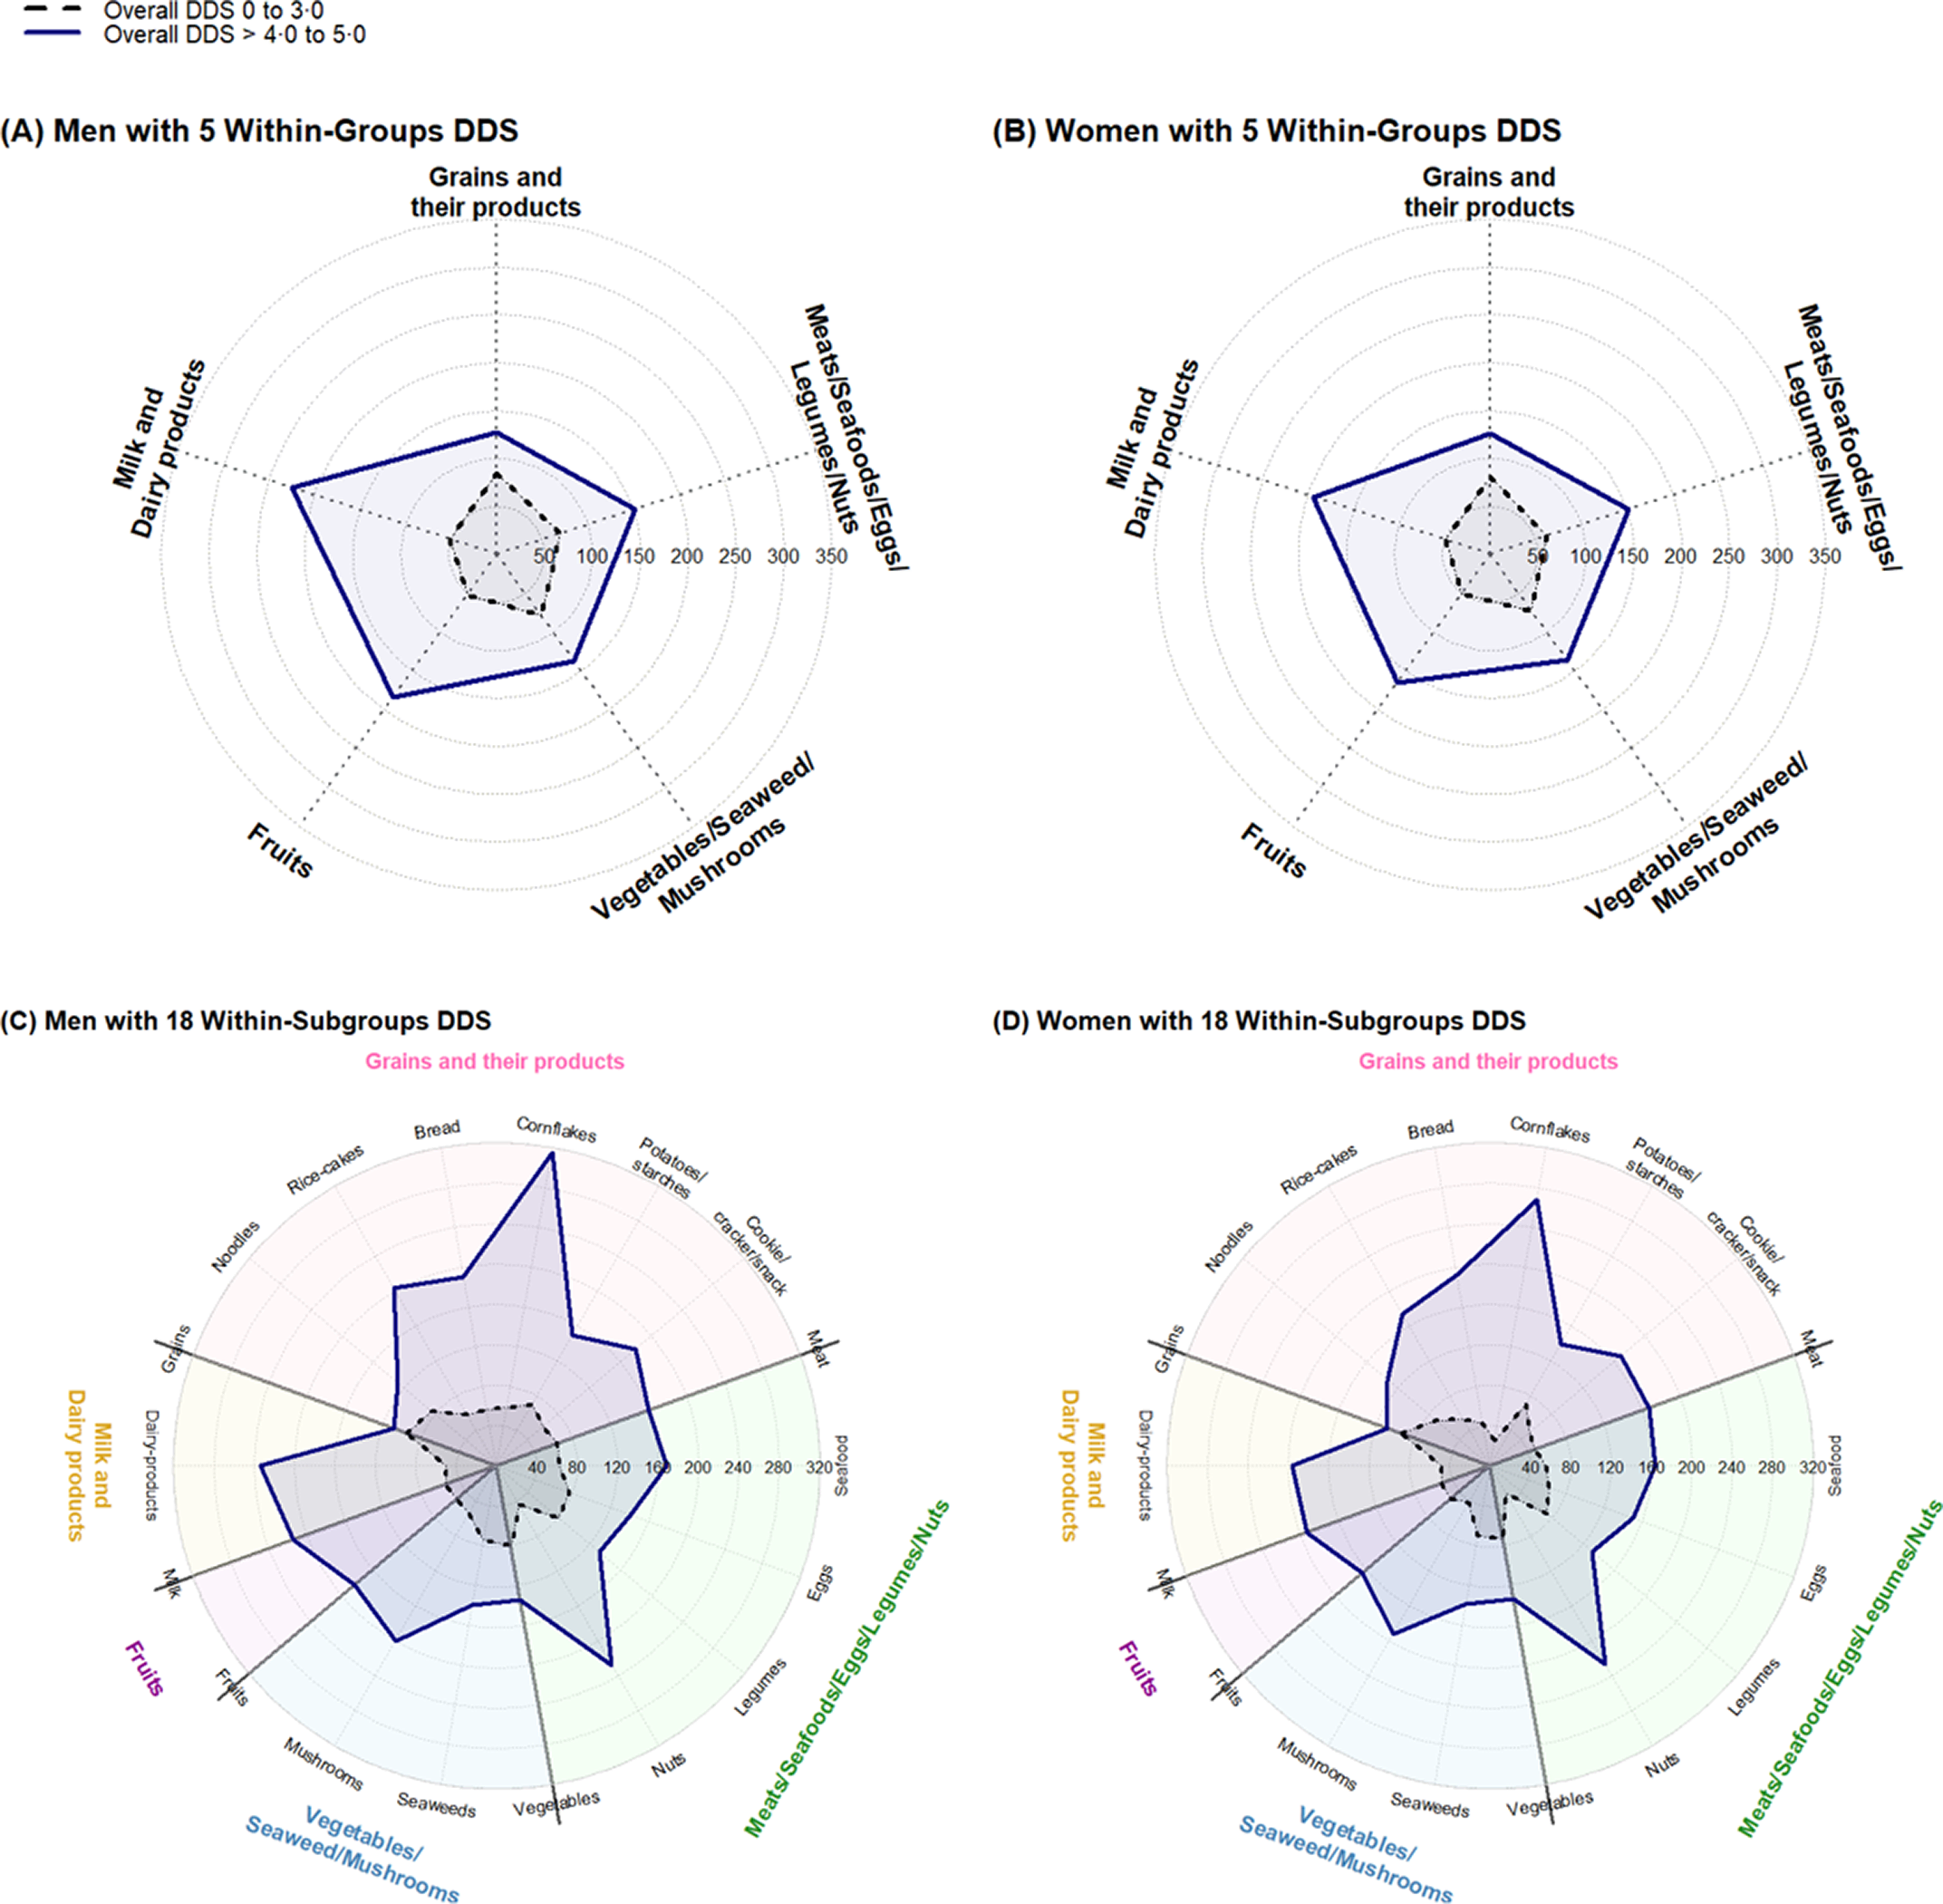
Although consuming a diverse diet is generally considered beneficial for chronic disease prevention, its relationship with type 2 diabetes (T2D) remains unclear. This study investigated the associations of overall and within-group dietary diversity scores (DDS) with T2D incidence in the Korean Genome and Epidemiology Study-CVD Association Study. A total of 16 666 participants aged 40 years and older without T2D at baseline were followed for 96 609 person-years, during which 953 incident T2D cases were identified. Cumulative average overall DDS and within-group DDS were derived from repeated FFQ administered at each visit. Modified Poisson regression with a robust error variance estimator was used to estimate incidence rate ratios (IRR) and 95 % CI. A significant inverse linear trend was observed between overall DDS and T2D risk (IRR = 0·56, 95 % CI = 0·40-0·79 for men; IRR = 0·73, 95 % CI = 0·54-0·98 for women). Among the five within-group DDS, those for 'Milk and Dairy products' in both sexes, 'Fruits' in men and 'Vegetables/Seaweeds/Mushrooms' in women were inversely associated with T2D (Q4 v. Q1). No significant sex-related interactions were observed (all p for interaction > 0·05). Higher overall DDS and greater within-group diversity in 'Milk and Dairy products,' 'Fruits' and 'Vegetables/Seaweeds/Mushrooms' were associated with lower T2D risk. These findings suggest that maintaining overall dietary diversity - particularly emphasising non-energy-dense food groups such as fruits, vegetables, and dairy - may help prevent T2D.
From the paper
- Participants
A total of 16 666 participants contributed to 96 609 person-years of follow-up data (men: 35 712; women: 60 897), during which 953 incident T2D cases occurred (men: 413; women: 540) over a median follow-up of 5·96 years (interquartile range, 3·17–8·76).
- Result
A clear inverse association between overall DDS and T2D risk was evident for both men and women (IRR = 0·56, 95 % CI = 0·40–0·79, p for linear trend = 0·0004 for men; IRR = 0·73, 95 % CI = 0·54–0·98, p for linear trend = 0·0325 for women).
- Limitation
First, although repeated data from a validated FFQ were used, the questionnaire could not fully capture dietary diversity due to the limited number of items and the inability to distinguish subtypes within specific categories (e.g. whole v. refined grains).
Quoted word for word from the full text on cambridge.org.
- Fruits
- Milk and dairy product diversity
- Overall dietary diversity
- Type 2 diabetes
- Overall dietary diversity score
- Humans
The paper
Hanyang University
The British Journal of Nutrition, 15 Oct 2026