Associations of Insulin Resistance Surrogate Indices With Component-Defined Metabolically Unhealthy Phenotype Among Women With Overweight or Obesity: A Cross-Sectional Analysis of CHNS and NHANES
Dose-response
Abstract
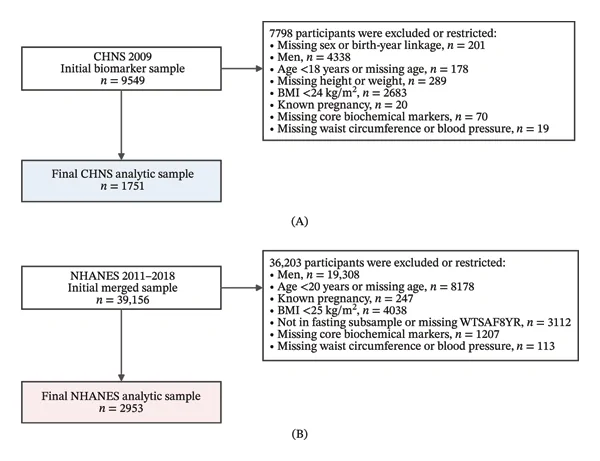
BACKGROUND: Women with overweight or obesity are metabolically heterogeneous, and body mass index (BMI) alone does not fully characterise their endocrine and metabolic health. We examined associations between five insulin resistance surrogate indices and a component-defined metabolically unhealthy phenotype (MUP) to characterise insulin resistance-related metabolic variation in this population. METHODS: This cross-sectional analysis used the China Health and Nutrition Survey (CHNS) 2009 for discovery and the National Health and Nutrition Examination Survey (NHANES) 2011-2018 for independent replication. Final samples comprised 1751 CHNS and 2953 NHANES participants. The indices were homeostasis model assessment of insulin resistance (HOMA-IR), triglyceride-glucose index (TyG), triglyceride-to-high-density lipoprotein cholesterol ratio (TG/HDL-C), triglyceride-glucose body mass index (TyG-BMI) and metabolic score for insulin resistance (METS-IR). MUP was defined as at least two abnormal metabolic components. Modified Poisson regression estimated prevalence ratios (PRs) per 1-standard-deviation increment and across quartiles. Fully adjusted models included 1721 CHNS and 2799 NHANES participants. Receiver operating characteristic curves and areas under the curve (AUCs) provided a descriptive, exploratory assessment of internal discrimination. RESULTS: All five indices were positively associated with MUP in both datasets. Fully adjusted PRs per 1-standard-deviation increment ranged from 1.027 (95% confidence interval 1.011-1.043) for HOMA-IR to 1.133 (1.110-1.157) for TyG in CHNS and from 1.058 (1.024-1.094) for TG/HDL-C to 1.168 (1.144-1.192) for TyG in NHANES. Positive quartile gradients were observed for all indices (p for trend < 0.001). Exploratory internal discrimination for MUP showed different patterns across the two datasets. CONCLUSIONS: Higher values of all five indices were associated with MUP among women with overweight or obesity in both datasets. These findings highlight the co-occurrence of insulin resistance-related glucose and lipid disturbances with clustered metabolic abnormalities. They support considering metabolic function alongside adiposity when characterising endocrine-metabolic heterogeneity among women with overweight or obesity.
From the paper
- Participants
The final analytic samples comprised 1751 adult women with overweight or obesity from CHNS 2009 and 2953 adult women with overweight or obesity from NHANES 2011–2018.
- Limitation
Although the Discussion situates this overlap within a plausible shared biological pathway, the constructed multidomain metabolic burden score incorporated some of the same domains and therefore did not provide statistically independent validation of that pathway.
Quoted word for word from the full text on onlinelibrary.wiley.com.
- Lipid and ceramide metabolism
- Insulin resistance
- Metabolically unhealthy phenotype
- Overweight
- Obesity
- Humans
The paper
Ningbo Medical Center Lihuili Hospital; Nanjing Medical University
International Journal of Endocrinology, 14 Oct 2026, Open access