Serum T50 is not independently associated with coronary artery calcification in early chronic kidney disease
Abstract
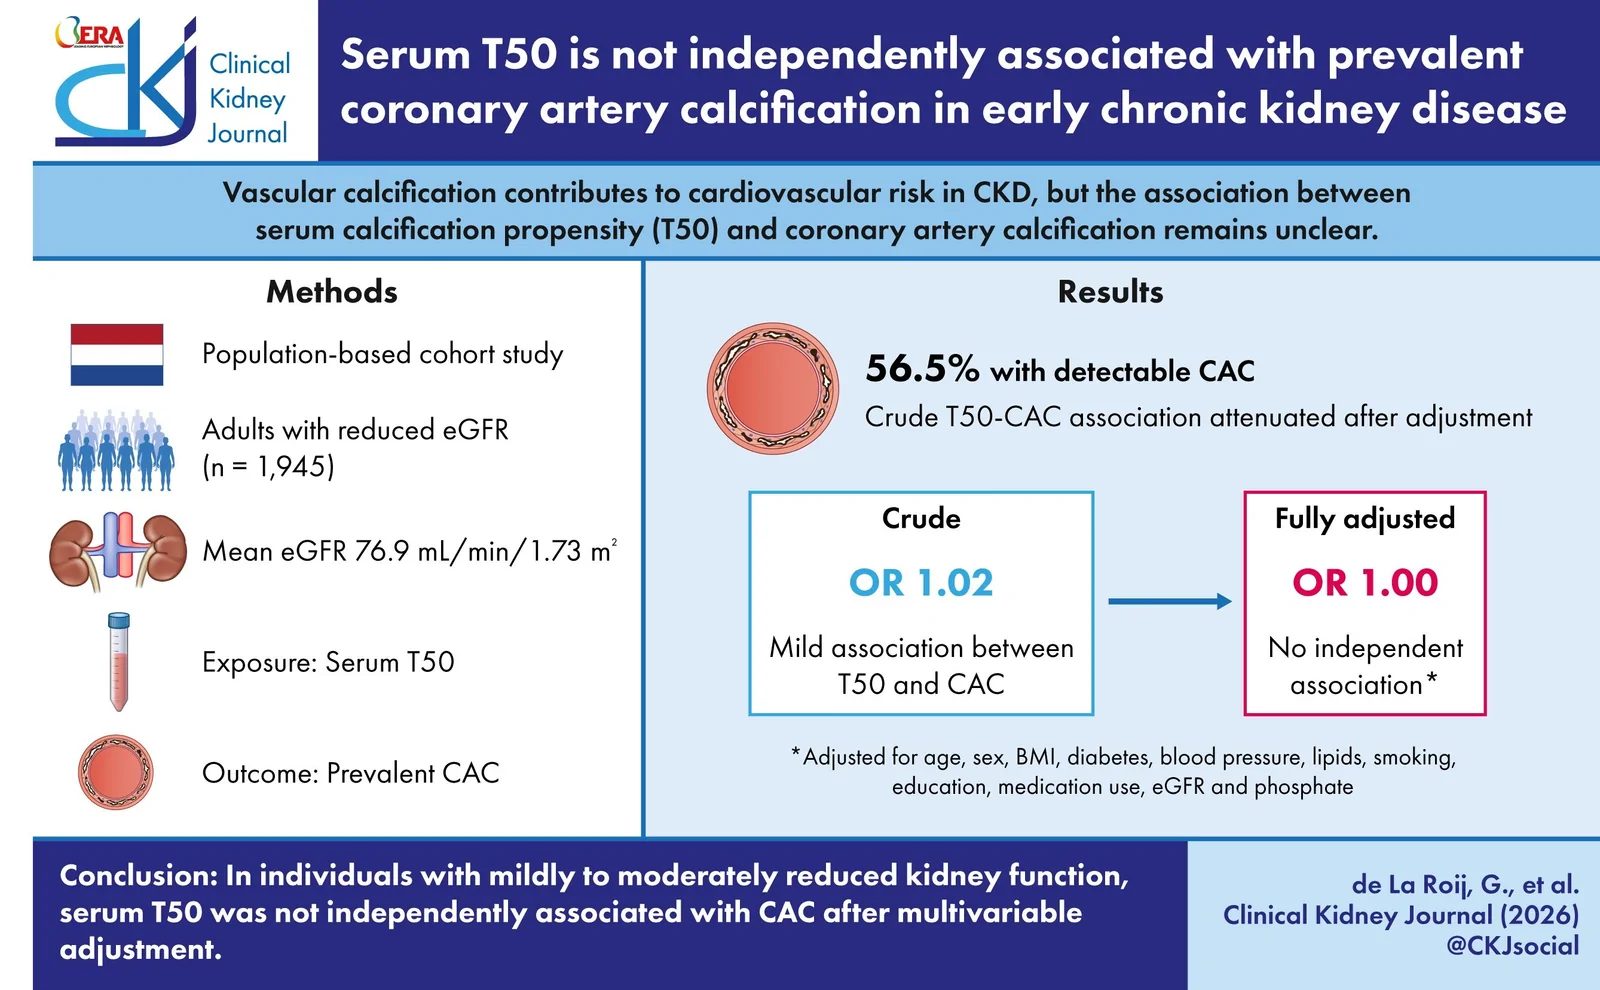
BACKGROUND: The serum T50 test quantifies calcification propensity, with lower values indicating a higher propensity for calcification. Lower T50 values have been associated with adverse cardiovascular outcomes, particularly in advanced chronic kidney disease. Whether serum T50 is associated with coronary artery calcification (CAC) in individuals with mildly to moderately reduced kidney function remains unclear. We examined this association in a population-based cross-sectional study. METHODS: We analysed 1945 participants from the population-based Lifelines ImaLife cohort with mildly to moderately reduced kidney function (estimated glomerular filtration rate, 37.5-87.6 ml/min/1.73 m²). Serum T50 was measured using a standardized nephelometric assay. CAC was assessed by electrocardiographically triggered non-contrast computed tomography and categorized into 0, 1-99, 100-399, and ≥400 Agatston units. Associations between continuous T50 (per 10-min increase) and CAC categories were examined using multinomial logistic regression. RESULTS: Of the 1945 participants, 56.5% had detectable CAC (CAC 1-99: 30.9%, 100-399: 14.4%, ≥400: 11.2%). In crude analyses, higher T50 values were associated with the presence of CAC [odds ratio (OR) 1.02, 95% confidence interval 1.01-1.03] and with CAC categories 1-99, 100-399, and ≥400 versus 0 (ORs 1.01, 1.02, and 1.03, respectively). These associations were no longer significant after adjustment for age, body mass index, and sex. Subgroup analyses did not identify risk groups in which T50 was significantly associated with the presence or severity of CAC. CONCLUSION: In this cohort with mildly to moderately reduced kidney function, T50 was not independently associated with prevalent CAC after multi-variable adjustment.
From the paper
- Participants
We analysed 1945 participants from the population-based Lifelines ImaLife cohort with mildly to moderately reduced kidney function (estimated glomerular filtration rate, 37.5–87.6 ml/min/1.73 m²).
- Result
In crude analyses, higher T50 values were associated with the presence of CAC [odds ratio (OR) 1.02, 95% confidence interval 1.01–1.03] and with CAC categories 1–99, 100–399, and ≥400 versus 0 (ORs 1.01, 1.02, and 1.03, respectively).
- Limitation
Kidney function was assessed at a single time point without inclusion of albuminuria, which may have led to misclassification of CKD status.
Quoted word for word from the full text on academic.oup.com.
- Serum T50
- Coronary artery calcification
- Chronic kidney disease
- Coronary artery calcium score
- Estimated glomerular filtration rate
- Humans
The paper
Radboud University Nijmegen
Clinical Kidney Journal, 5 Oct 2026, Open access