Sleep-linked blood proteins associated with depression risk
Higher sleep-linked protein scores were associated with a lower depression rate during follow-up (hazard ratio 0.660); the abstract did not specify the comparison group.
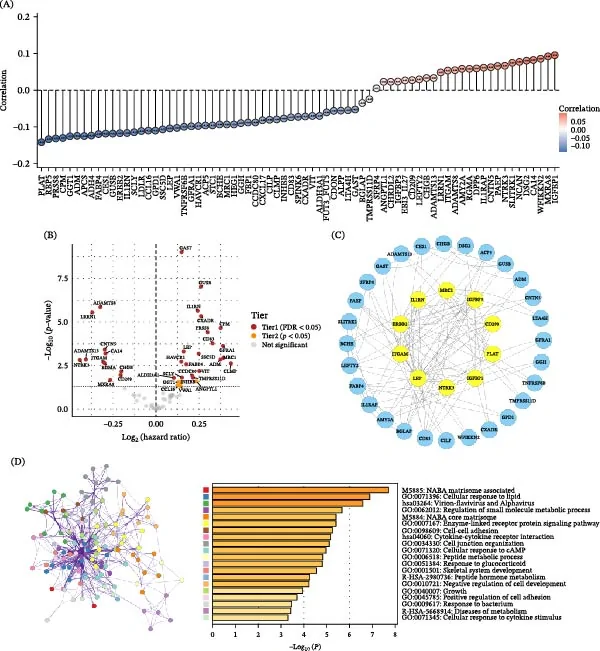
Researchers studied 36,852 UK Biobank participants in a prospective observational cohort study of sleep health, blood proteins and genetic susceptibility to depression. They assessed sleep duration, snoring, preferred sleep timing, insomnia symptoms and daytime sleepiness. They analysed 2,911 blood proteins and selected 73 associated with sleep health.
A score based on these proteins was associated with healthier sleep and lower risk of developing depression. Healthy sleepers also had lower depression risk, with a hazard ratio of 0.553. A hazard ratio compares the rate of new cases during follow-up. Further analysis suggested that the protein pattern statistically accounted for a modest part of the observed association between sleep health and depression.
Why it matters
Sleep health is associated with chronic diseases, making its relationship with mental health relevant to healthy aging. The protein patterns offer potential biological pathways for further investigation.
Caveats
The observational design cannot establish whether sleep or the protein patterns caused differences in depression risk. The findings require independent replication and causal validation before clinical interpretation.
From the paper
- Participants
A total of 36,852 participants were included in this study.
- Result
Healthy sleepers had a lower risk of depression (HR = 0.553, 95% CI: 0.454–0.674, p < 0.001), as did those with higher proteomic scores (HR = 0.660, 95% CI: 0.566–0.770, p < 0.001).
Quoted word for word from the full text on onlinelibrary.wiley.com.
The paper
The Second School of Medicine Wenzhou Medical University Wenzhou Zhejiang China wmu.edu.cn; The First Affiliated Hospital of Wenzhou Medical University Wenzhou China wzhospital.cn
Depression and Anxiety, 9 Oct 2026