Less rapid eye movement sleep is linked to Alzheimer's changes
In 64 older adults tracked for 2.6 years, lower rapid eye movement sleep was linked to a faster drop in a blood marker of Alzheimer's disease.
2.6 years
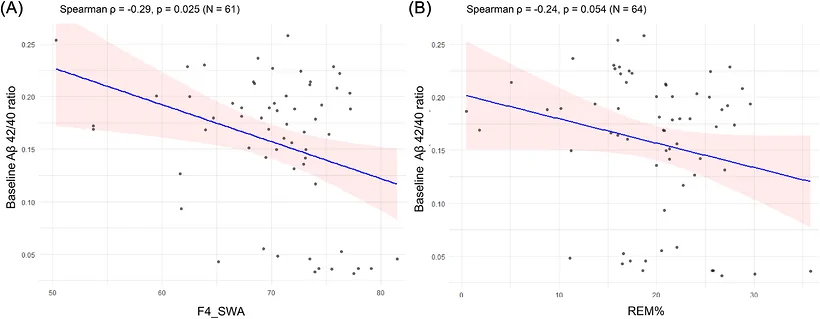
In an observational study, researchers tracked 64 cognitively unimpaired older adults aged 55 to 90 over 2.6 years. Participants underwent sleep monitoring near the start and gave blood samples twice to measure protein markers. The team analysed blood levels of amyloid beta 42 and 40, protein fragments that accumulate in Alzheimer's disease, using mass spectrometry. At the start, frontal slow-wave activity during deep sleep was inversely associated with the ratio of amyloid beta 42 to 40. Over time, a lower share of rapid eye movement (REM) sleep was linked to a large annualised decline in this ratio. In exploratory analyses, this link was stronger in participants who were already amyloid-positive.
Why it matters
Alzheimer's disease is an age-related condition that involves amyloid accumulation in a preclinical stage. Understanding how sleep architecture relates to these early protein changes may help identify whether sleep stages can serve as early biomarkers or modifiable targets for intervention.
Caveats
The study was observational and included only 64 participants. Sleep was also recorded at a single time point near the start rather than monitored continuously over the 2.6 years.
From the paper
- Result
Low REM% remained significantly associated with a large, annualized decline of plasma Aβ42/40 ratio after adjusting for age, sex, APOE ε4 status, OSA status, and SSRI/SNRI use in a general linear model (β = 0.0024, 95% CI [0.00015 to 0.0047], p = 0.043; Table 3).
Results, 3.3 Relationship between sleep variables and annualized ΔAβ42/40 ratio
Quoted word for word from the full text on alz-journals.onlinelibrary.wiley.com.
- Rapid eye movement sleep
- Slow-wave sleep
- Alzheimer's disease
- Amyloid-beta 42
- Frontal slow-wave activity
- Humans
The paper
Icahn School of Medicine at Mount Sinai
Alzheimer's & Dementia, 1 Oct 2026, Open access

