BiomarkersHumans723 consecutive adultsCross-sectional studyDose-response

Association of the Triglyceride-Glucose Index with Ambulatory Blood Pressure Categories and Circadian Blood Pressure Phenotypes in Untreated Adults: A Single-Centre, ABPM-Based Retrospective Cross-Sectional Study
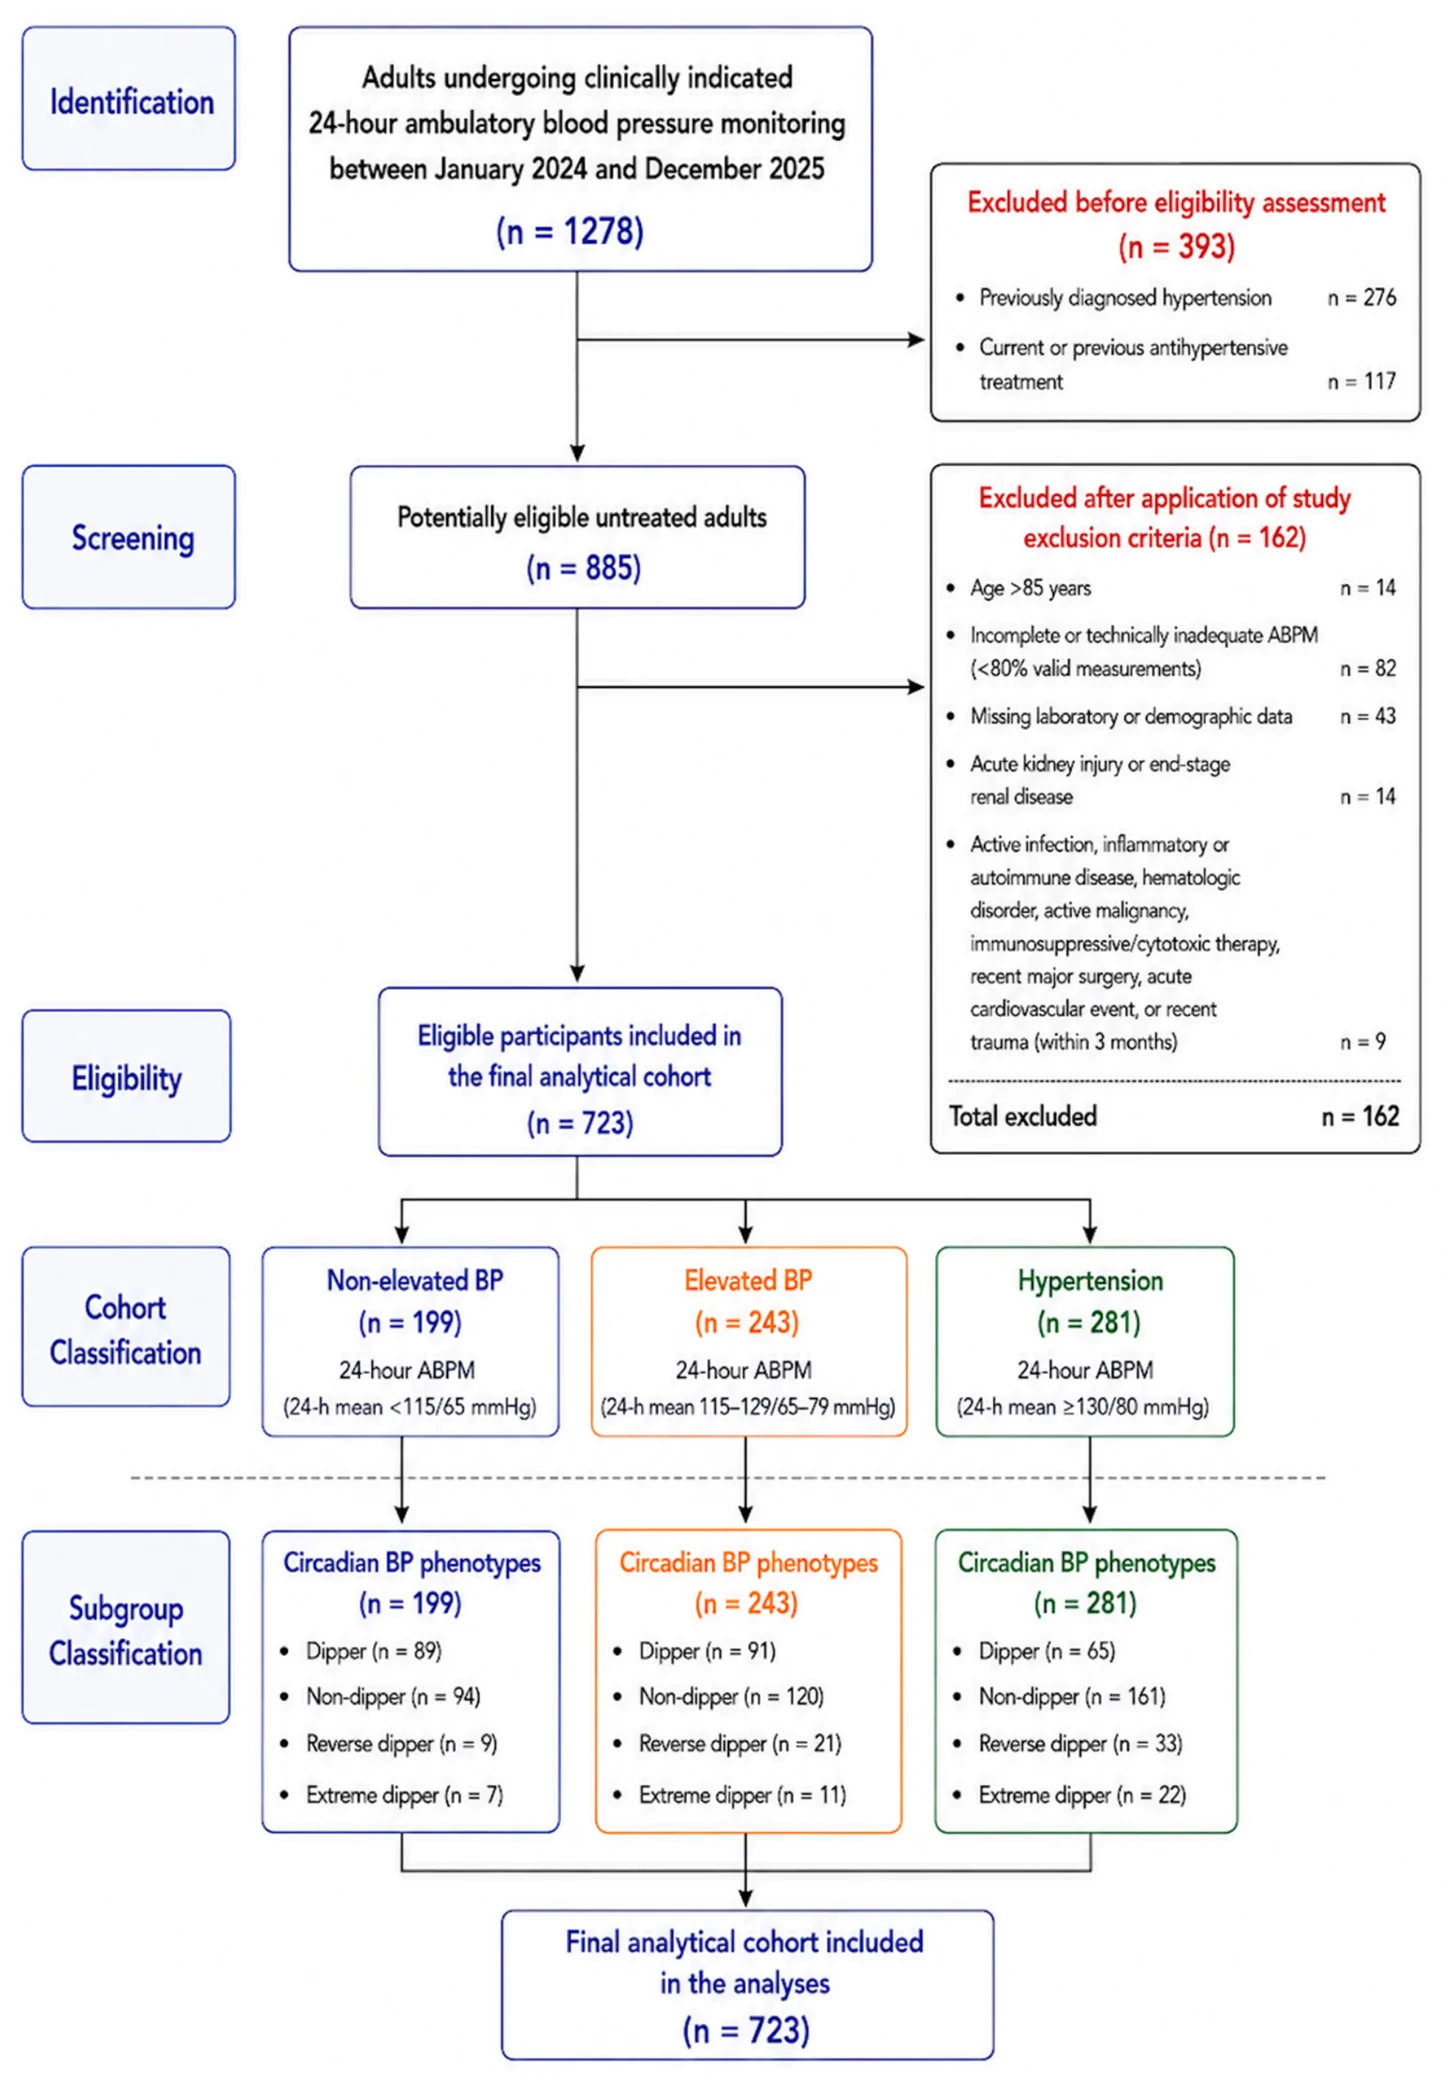
Figure 1. STROBE flow diagram illustrating participant selection, cohort derivation, ambulatory blood pressure classification, and circadian blood pressure phenotyping.
Open the figure at full size
Figure 1. STROBE flow diagram illustrating participant selection, cohort derivation, ambulatory blood pressure classification, and circadian blood pressure phenotyping.STROBE flow diagram illustrating participant selection, cohort derivation, ambulatory blood pressure classification, and circadian blood pressure phenotyping.Savcilioglu et al.

Diagnostics

The paper