Serum uric acid and insulin resistance-related indices in relation to incident cardiovascular disease under the updated 2026 cardiovascular-kidney-metabolic framework: a prospective cohort study
Abstract
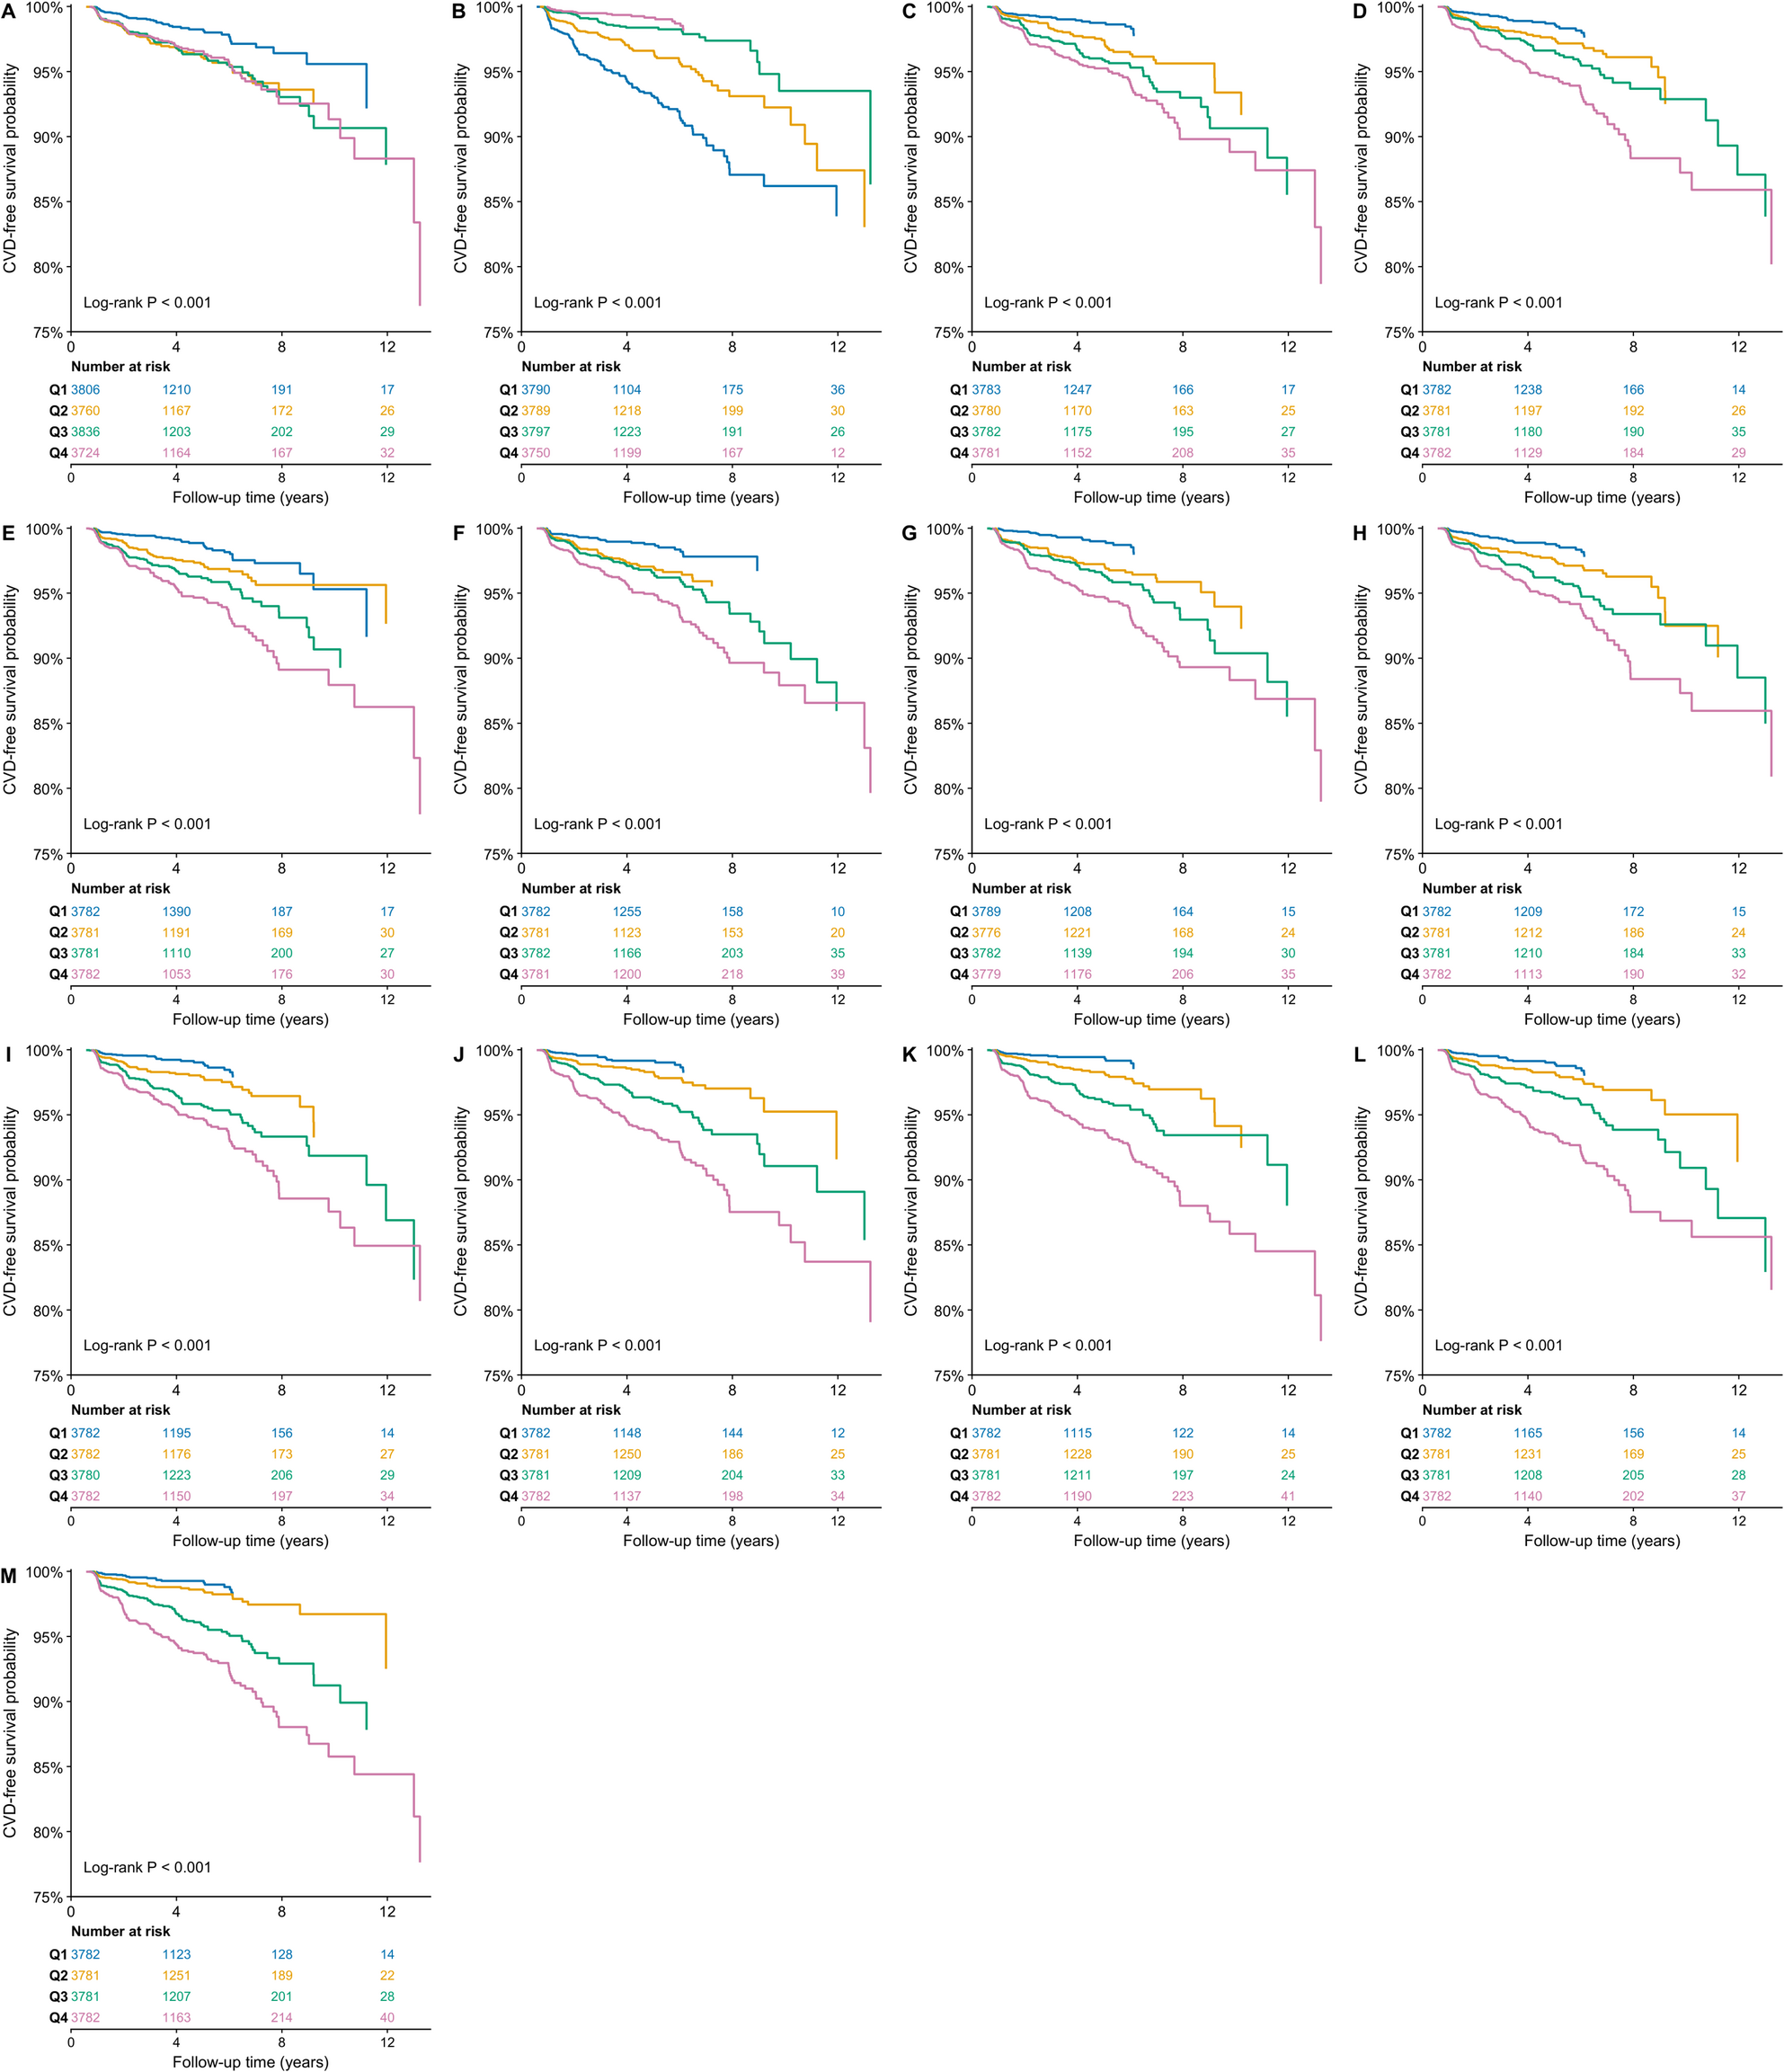
Insulin resistance and Serum uric acid (UA) are associated with cardiovascular-kidney-metabolic (CKM) dysfunction, but their individual and joint associations with cardiovascular disease (CVD) under the updated 2026 CKM framework remain insufficiently characterized. We evaluated UA and multiple insulin resistance-related indices in relation to incident CVD across CKM stages 0–3. This prospective cohort included 15,126 adults free of clinical CVD at baseline, who were classified as CKM stages 0–3 using a data-adapted implementation of the updated 2026 CKM framework. The Predicting Risk of Cardiovascular Disease Events (PREVENT-CVD) equation was used as one criterion for stage 3 classification among eligible participants. UA and 12 insulin resistance-related indices were evaluated, including estimated glucose disposal rate (eGDR), atherogenic index of plasma (AIP), metabolic score for insulin resistance (METS-IR), C-reactive protein–triglyceride-glucose index (CTI), cholesterol–high-density lipoprotein–glucose index (CHG), triglyceride-glucose index (TyG), and six TyG-derived anthropometric indices. Associations were assessed using Cox regression, Kaplan–Meier analysis, restricted cubic splines, joint exposure analyses, CKM stage-stratified analyses, and subgroup analyses. Joint analyses were further evaluated using clinically defined hyperuricemia and formal additive and multiplicative interaction tests. Time-dependent AUCs, Harrell C-indices, integrated discrimination improvement (IDI), and net reclassification improvement (NRI) were used to evaluate predictive performance. During follow-up, 344 incident CVD events occurred. In the fully adjusted model, each 1-SD increase in UA was associated with a 29% higher CVD risk [HR 1.29 (95% CI 1.13–1.48)]. Higher eGDR was inversely associated with CVD [HR 0.70 (0.62–0.79)], whereas the remaining insulin resistance-related indices showed positive associations, with HRs per 1-SD increase ranging from 1.30 to 1.44. Participants with high UA and low eGDR had higher CVD risk [HR 2.51 (1.69–3.75)]. High UA combined with high levels of the other indices was also consistently associated with increased risk, with HRs ranging from 1.78 to 2.45. Joint analyses using clinically defined hyperuricemia yielded consistent findings, and no significant additive or multiplicative interactions were observed. Associations varied across CKM stages, and CTI, CHG, and TyG showed stronger associations among adults aged < 45 years (all P for interaction ≤ 0.05). eGDR and TyG-WWI provided the most favorable standalone discrimination, with overall Harrell C-indices of 0.711 (0.682–0.740) and 0.710 (0.682–0.738), respectively. Adding eGDR to the multivariable base model improved the overall C-index by 0.013 (P = 0.002), whereas UA alone did not significantly improve discrimination. The main associations remained robust across sensitivity analyses. Among adults with CKM stages 0–3 classified using a data-adapted implementation of the updated 2026 CKM framework, higher UA and adverse insulin resistance-related profiles were associated with incident CVD, and adverse joint profiles were associated with higher observed risk. UA showed limited incremental predictive value, whereas eGDR and TyG-WWI demonstrated more favorable predictive performance, with eGDR providing modest incremental discrimination beyond the study-specific base model. These findings support further evaluation of routinely available insulin resistance-related indices as convenient, noninvasive markers for cardiovascular risk assessment. Insulin resistance is associated with cardiovascular risk across CKM stages 0–3. Several insulin resistance-related indices, including TyG-derived indices and eGDR, are associated with incident CVD and may improve risk discrimination. UA is associated with cardiometabolic abnormalities and cardiovascular risk, but its joint associations with a broad range of insulin resistance-related indices remain insufficiently characterized. How are UA and 12 insulin resistance-related indices, individually and jointly, associated with incident CVD across CKM stages 0–3 under the updated 2026 CKM framework? Higher UA and adverse insulin resistance-related profiles were associated with increased incident CVD risk, with distinct patterns across CKM stages. The combination of elevated UA and an adverse insulin resistance profile identified groups with higher cardiovascular risk. eGDR and TyG-WWI provided the most favorable standalone discrimination, while eGDR showed modest incremental discrimination when added to the study-specific base model. Routinely available UA and insulin resistance-related indices, particularly eGDR and TyG-WWI, may provide additional information for cardiovascular risk assessment before clinical CVD develops.
From the paper
- Participants
This prospective cohort included 15,126 adults free of clinical CVD at baseline, who were classified as CKM stages 0–3 using a data-adapted implementation of the updated 2026 CKM framework.
- Result
In the fully adjusted model, each 1-SD increase in UA was associated with a 29% higher CVD risk [HR 1.29 (95% CI 1.13–1.48)].
Quoted word for word from the full text on link.springer.com.
- Uric acid
- Insulin resistance
- Cardiovascular disease
- Cardiovascular-kidney-metabolic dysfunction
- Atherogenic index of plasma
- Humans
The paper
Hainan Medical University
Cardiovascular Diabetology, 13 Oct 2026, Open access, CC BY-NC-ND