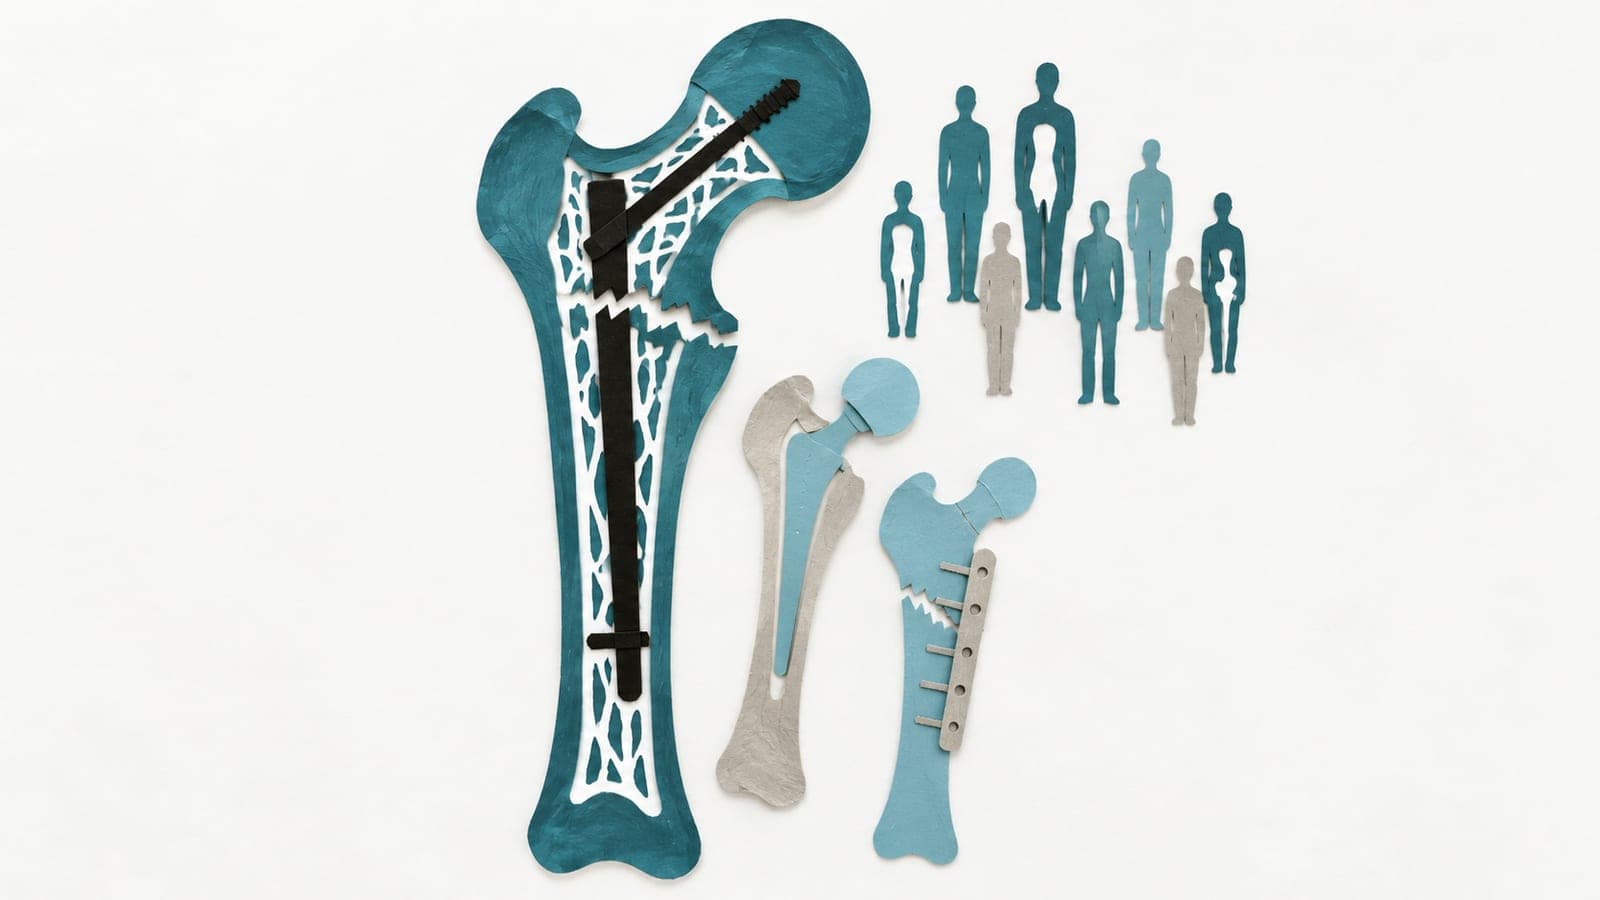
Hip fracture surgery death rates were higher at 100 and older
Deaths by 12 months reached 80.6% among people aged 100 or older, compared with 30.1% among those aged 65–99 in a retrospective cohort.
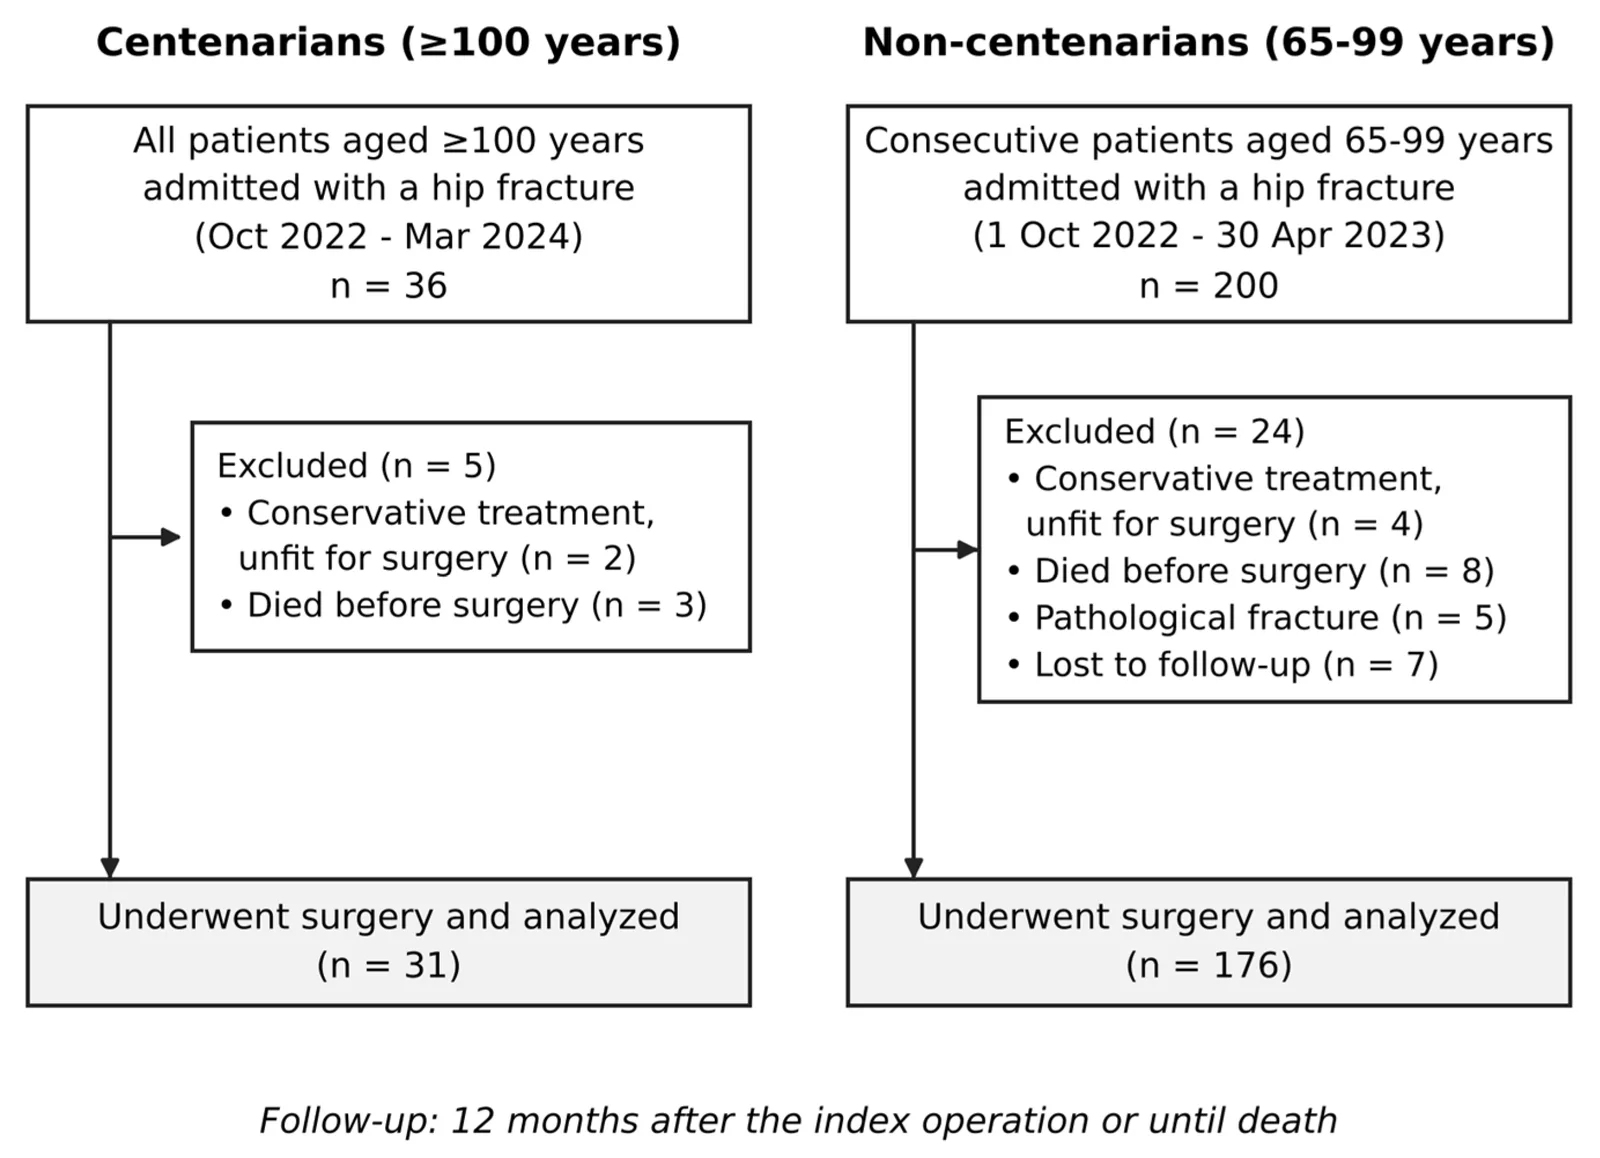
176 participants
Limit: Unmeasured frailty and pre-fracture function could partly explain the mortality difference
Edited by Boris Djordjevic · AgingResearch.News
This retrospective cohort study compared 31 people aged 100 or older who underwent hip fracture surgery with 176 people aged 65–99. Researchers examined deaths within 30 days and 12 months, along with factors associated with mortality.
Within 30 days, 29.0% of centenarians died, compared with 6.2% of the younger group. Complications occurred in 35.5% versus 30.1%, a difference that was not statistically significant. Centenarians also spent longer in intensive care and in the hospital. Being 100 or older and having higher scores indicating poorer physical health before surgery were associated with higher mortality. Longer waits for surgery were associated with higher 12-month mortality.
Why it matters
The authors argued that hip fractures in people aged 100 or older should prompt early discussions about patients’ goals for care.
Caveats
This observational study could not establish cause and effect, and unmeasured factors such as frailty may have contributed to the associations. The oldest group included only 31 people who underwent surgery; the findings do not describe centenarians managed without surgery.
From the paper
- Participants
The final analysis comprised 31 centenarians and 176 non-centenarians, with approximately two-thirds of each group being women.
- Follow-up
All patients were followed for 12 months after the index operation or until death.
- Result
In the primary 30-day mortality model (n = 207; 20 deaths), centenarian status (odds ratio [OR] 4.87, 95% CI 1.73–13.60, p = 0.003) and higher ASA scores (OR 4.03 per point, 95% CI 1.87–9.48, p < 0.001) were significantly associated with increased mortality (Table 3).
- Limitation
First, its retrospective design limits causal inference and is subject to selection and information bias.
Quoted word for word from the full text on mdpi.com.
- Hip fracture surgery
- Time to surgery
- Hip fracture
- ASA score
- Comorbidity-only Charlson Comorbidity Index
- Humans
The paper
Comparative Outcomes of Hip Fractures in Centenarians Compared to Non-Centenarians
Sağlık Bilimleri Üniversitesi
Journal of Clinical Medicine, Oct 21, 2026, Open access