Associations Between Multidimensional Obesity Indices and Diabetic Peripheral Neuropathy and Comparison of Their Discriminative Performance
Abstract
PURPOSE: Obesity is an important risk factor for diabetic peripheral neuropathy (DPN), but body mass index (BMI) may not fully reflect variations in fat distribution and overall obesity. This study evaluated the associations between multiple obesity-related indices and DPN risk and compared their discriminative performance and potential clinical value. PATIENTS AND METHODS: A total of 950 participants were enrolled. Fourteen obesity-related indices were assessed: BMI, waist circumference (WC), hip circumference (HC), weight-adjusted waist index (WWI), waist divided by height0.5 (WHT.5R), waist-to-hip ratio (WHR), conicity index, a body shape index (ABSI), abdominal volume index (AVI), body surface area (BSA), body roundness index (BRI), relative fat mass (RFM), metabolic score for visceral fat (METS-VF), and Chinese visceral adiposity index (CVAI). Binary logistic regression evaluated associations with DPN using continuous and categorical variables. Sensitivity and subgroup analyses assessed robustness and potential effect modification. Receiver operating characteristic (ROC) curves and decision curve analysis evaluated discriminative performance and potential clinical net benefit. RESULTS: After adjustment for potential confounders, all fourteen obesity-related indices were positively associated with DPN risk per standard deviation increase. RFM showed the strongest association (OR = 3.631, 95% CI: 2.576-5.118), followed by conicity index (OR = 2.792, 95% CI: 2.282-3.416). Sensitivity analyses showed that these associations remained generally stable. Among all indices, conicity index had the highest area under the curve (AUC = 0.727), with an optimal cutoff of 1.279. Decision curve analysis indicated that conicity index provided relatively better potential clinical net benefit. CONCLUSION: Multiple obesity-related indices were associated with increased DPN risk. RFM showed the strongest association, whereas conicity index demonstrated better discriminative performance and potential clinical net benefit. Incorporating conicity index into early DPN screening strategies may facilitate the earlier detection of individuals at high risk. However, its clinical applicability requires further validation in prospective studies and external populations.
From the paper
- Participants
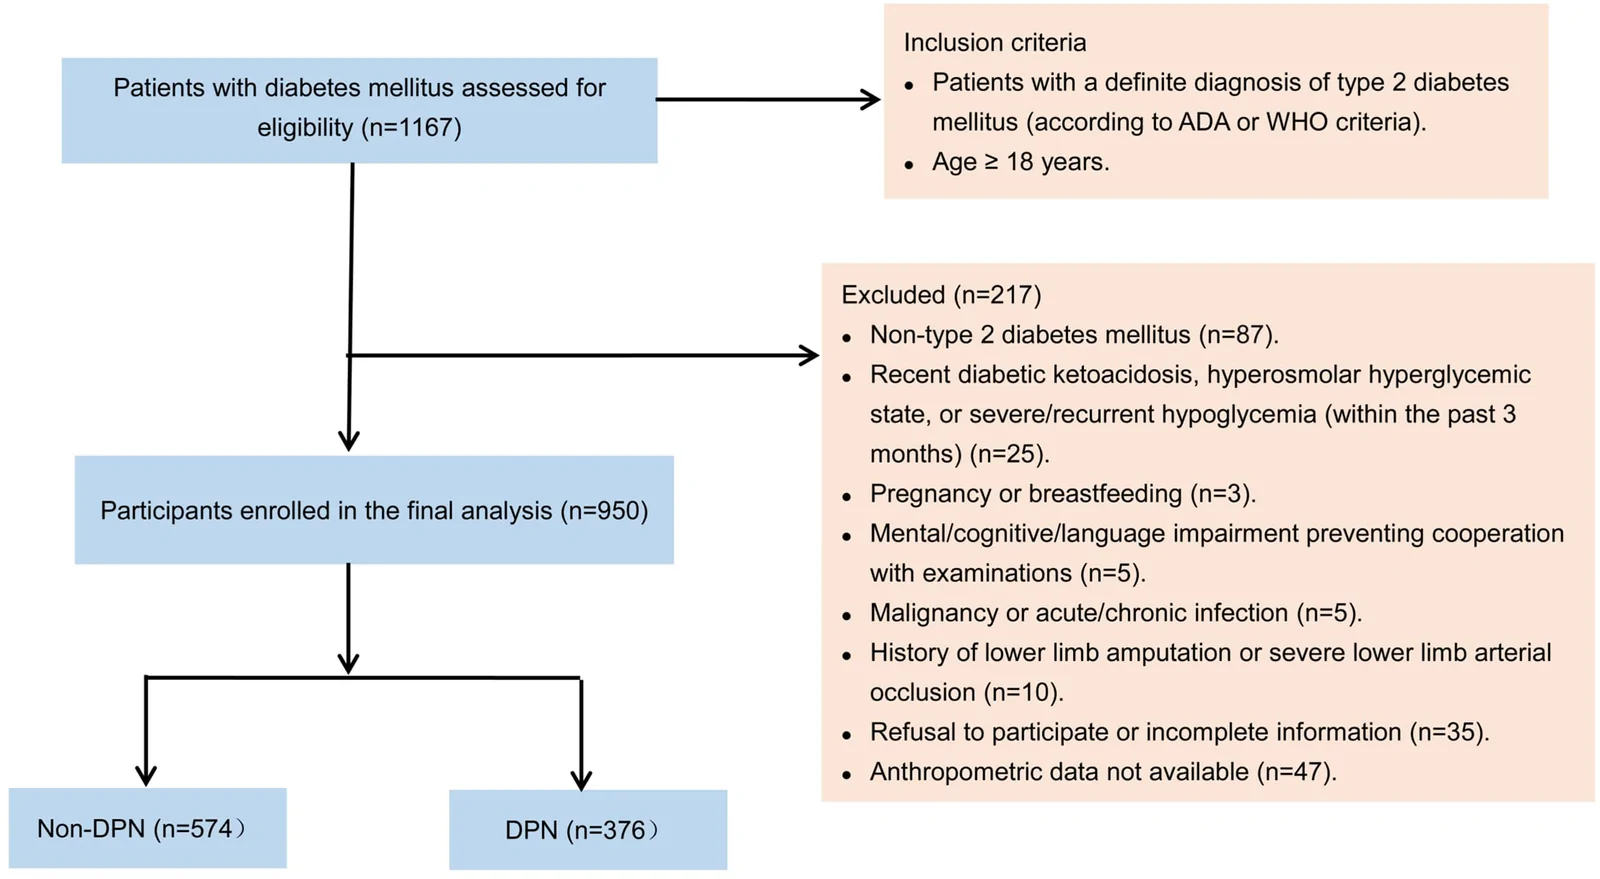
A total of 950 participants were enrolled in this study, including 574 in the non-DPN group and 376 in the DPN group.
- Result
RFM showed the largest effect estimate (OR = 3.631, 95% CI: 2.576–5.118), followed by conicity index (OR = 2.792, 95% CI: 2.282–3.416) and ABSI (OR = 2.463, 95% CI: 2.025–2.996).
Results, Association Between Different Obesity Indices and DPN
Quoted word for word from the full text on PubMed Central.
The paper
Harbin Medical University
Diabetes, Metabolic Syndrome and Obesity, 8 Oct 2026, Open access


