Machine Learning Prediction of Incident Hypertension in Australian Men: Integrating Survey, Pharmaceutical and Healthcare Utilisation Data From the Ten to Men Cohort
10 years, declared no competing interests
Abstract
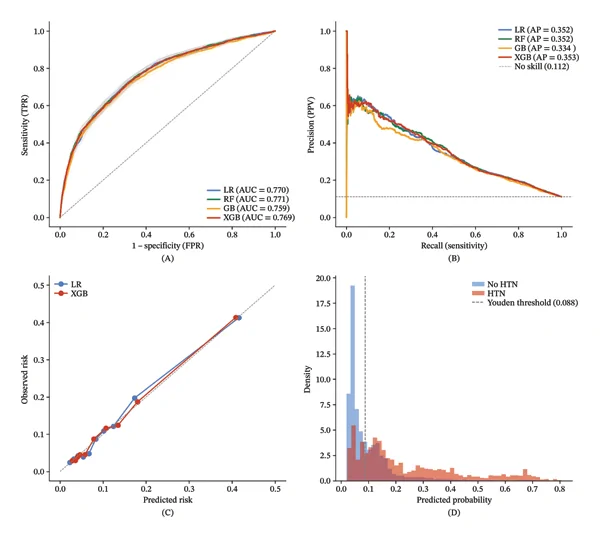
BACKGROUND: Hypertension is a leading modifiable contributor to cardiovascular disease. We developed and evaluated machine learning models to predict incident hypertension in Australian men using baseline survey data linked to pharmaceutical (PBS) and healthcare utilisation (MBS) administrative records from the Ten to Men cohort. METHODS: Among 13,519 men free of hypertension at baseline (2014), incident hypertension over 10 years was ascertained from PBS antihypertensive dispensing. Twenty-five baseline features spanning sociodemographic, anthropometric, lifestyle, clinical and administrative domains were used to train logistic regression, random forest, gradient boosting and XGBoost models, evaluated by five-fold cross-validation with out-of-fold prediction. Discrimination, calibration and threshold-based operating characteristics were reported with 95% confidence intervals. RESULTS: Incident hypertension occurred in 1310 men (9.7%). All algorithms achieved comparable discrimination (AUROC ≈ 0.77; XGBoost 0.771, 95% CI: 0.756-0.784), with no material advantage for flexible tree-based methods over regularised logistic regression. Age, administrative markers of healthcare engagement and BMI were the leading predictors, and a parsimonious six-variable model recovered almost all the discrimination of the full model. The model showed high negative predictive and low positive predictive values across decision thresholds, consistent with the 9.7% event rate. Incorporating measured blood pressure history from intervening waves increased apparent discrimination, but this gain was attributable to information contemporaneous with the outcome and is reported only as a concurrent surveillance benchmark. CONCLUSIONS: Routinely collected survey and administrative data can identify Australian men at low risk of incident hypertension with high negative predictive value, supporting population-level risk stratification rather than individual diagnosis. Predictive performance was driven by feature availability and quality rather than algorithm choice.
The paper
Edith Cowan University; Flinders University
International Journal of Hypertension, 25 Aug 2026