Air pollution linked to overlapping chronic diseases in China
Higher pollution-mixture scores were associated with greater odds of developing overlapping conditions than lower scores, with an odds ratio of 1.25.
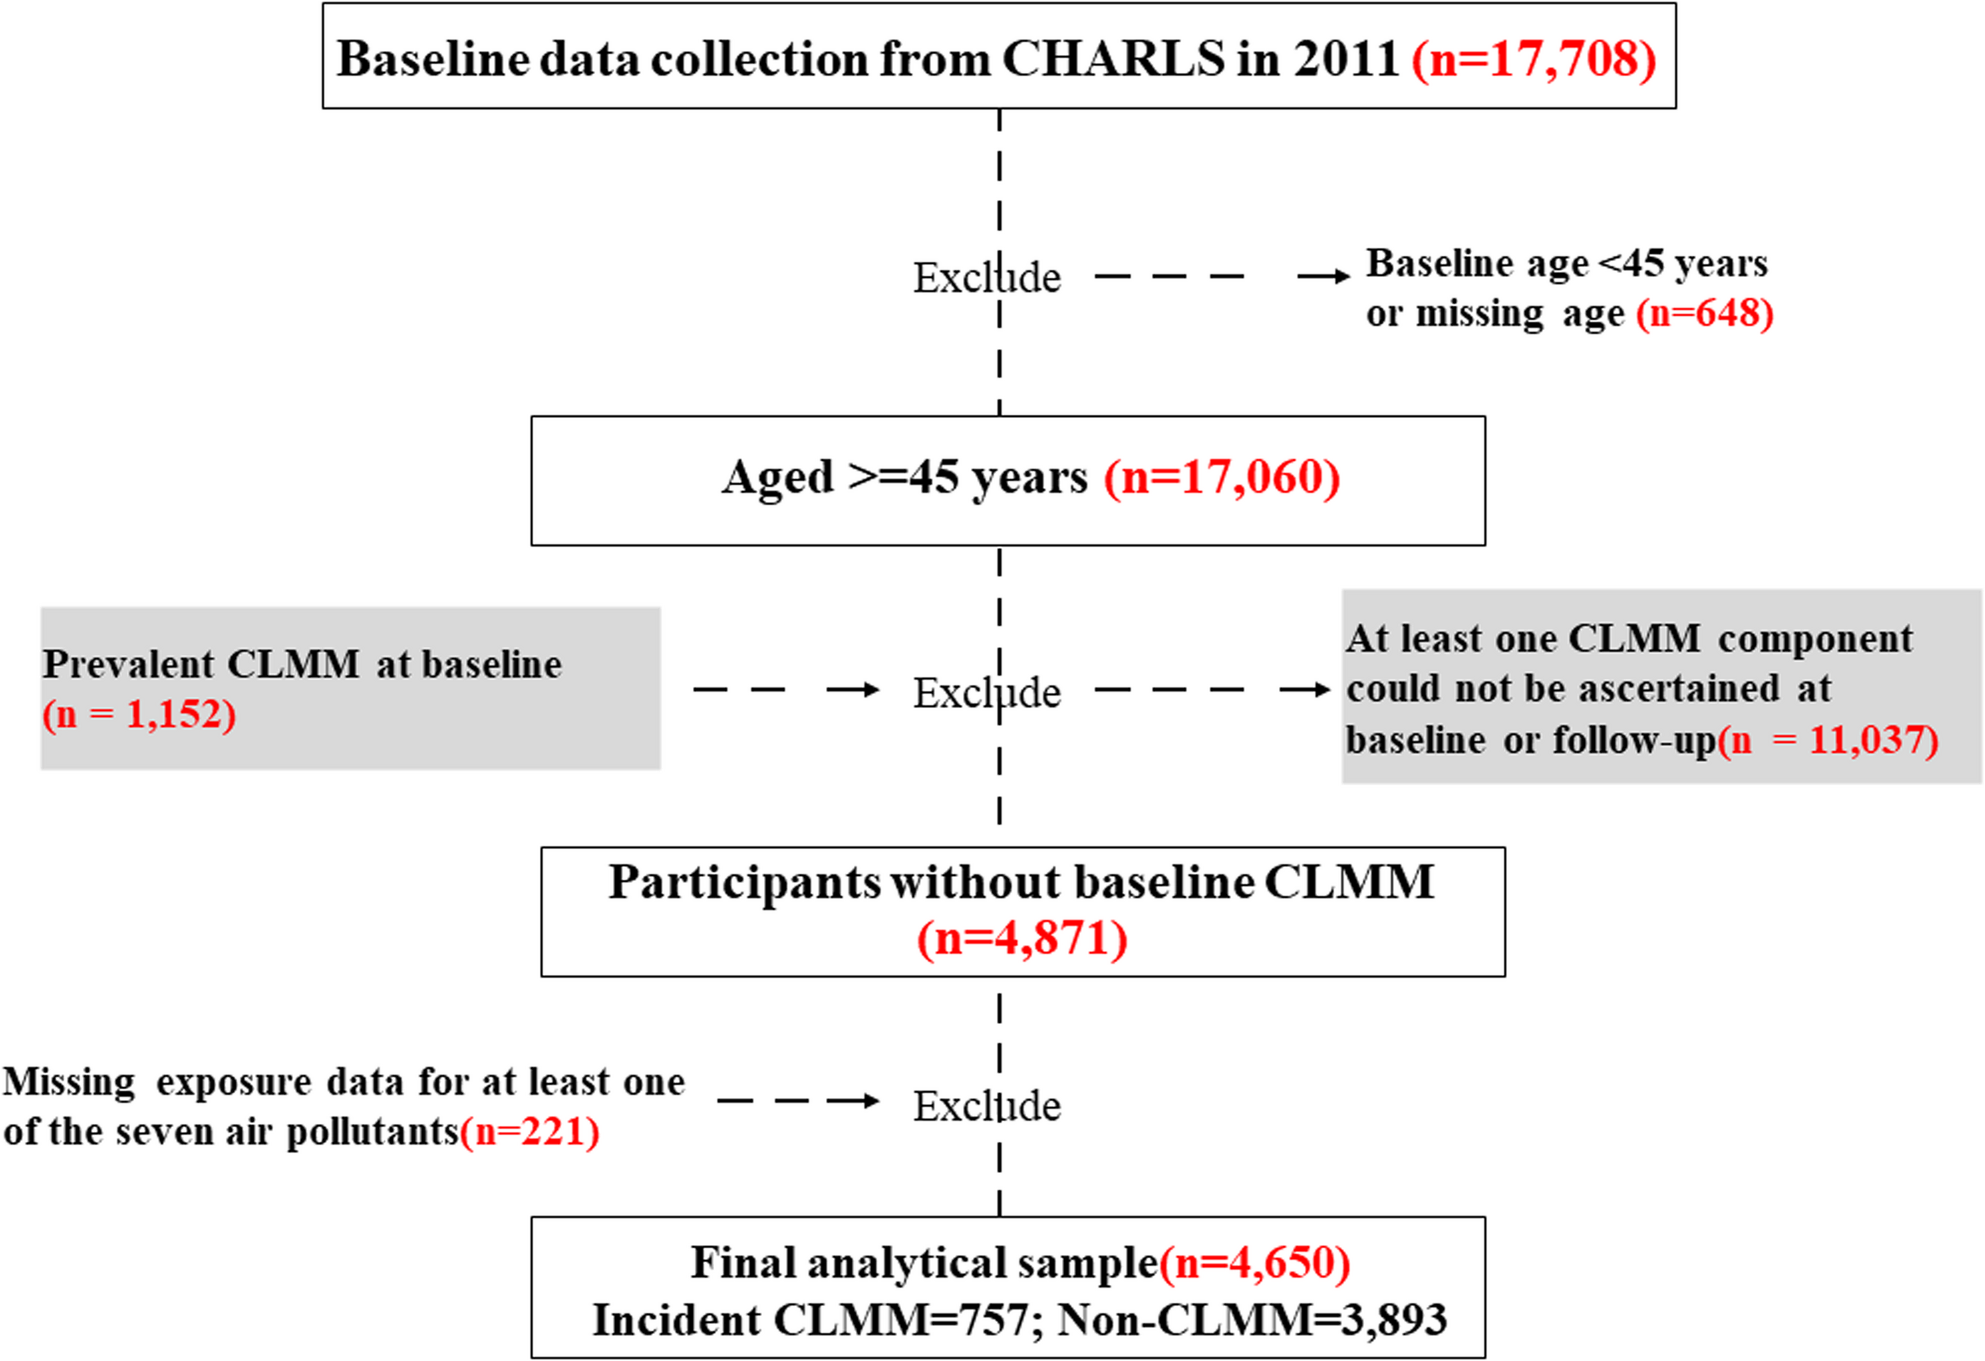
In an observational cohort study, researchers followed 4,650 middle-aged and older adults in China from 2011 to 2015. They used city-level estimates of seven air pollutants across 119 cities. They tracked new combinations involving at least two conditions: heart and blood vessel disease, diabetes, and probable fatty liver disease associated with metabolic problems.
During follow-up, 757 participants (16.3%) developed these overlapping conditions. The pollution-mixture score was associated with higher odds, with an odds ratio of 1.25; a ratio above one indicates higher odds. Fine and larger airborne particles, carbon monoxide and nitrogen dioxide were each associated with the outcome when analysed separately. These links weakened after accounting for other pollutants. Models including three pollutants no longer provided clear evidence of any individual link.
Why it matters
The authors called for further evaluation of air pollution as a potentially modifiable environmental factor associated with multiple chronic diseases in middle-aged and older adults.
Caveats
This observational study could not establish cause and effect, and pollution estimates were city-level rather than individual. The liver outcome represented probable disease, and the authors called for finer exposure assessment and validation in other populations.
From the paper
- Participants
We analyzed 4,650 adults from 119 cities in the China Health and Retirement Longitudinal Study at the 2011 baseline and 2015 follow-up.
- Result
In fully adjusted single-pollutant models, the odds ratios per interquartile-range increase were 1.33 (95% CI 1.10–1.61) for PM₂.₅, 1.42 (1.13–1.77) for PM₁₀, 1.30 (1.08–1.56) for CO, and 1.30 (1.06–1.58) for nitrogen dioxide.
Quoted word for word from the full text on link.springer.com.