Routine data helped target frailty checks in chronic disease
In the model’s validation sample, screening the highest-risk 20% identified 55.6% of frailty cases, a 2.78-fold improvement over random screening.
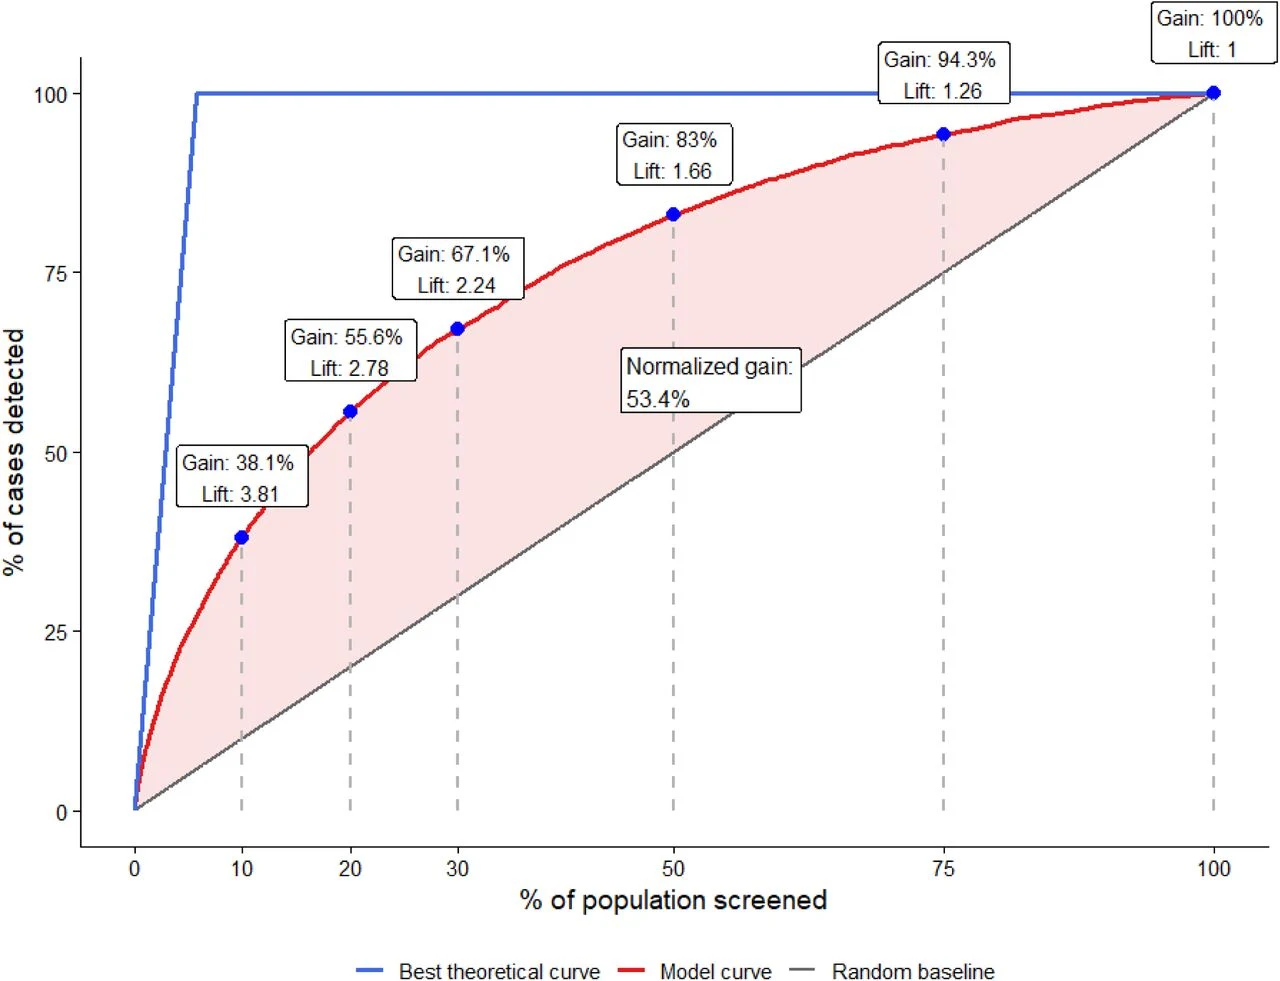
An observational prediction study used UK Biobank data from 281,729 adults with at least one chronic condition, whose mean age was 57.9. Researchers combined 12 routine, low-cost clinical measures in a model to predict frailty, a state of reduced resilience to illness or injury. Overall, 5.8% of participants were frail.
The team developed the model using 187,819 participants and tested it in a separate group of 93,910. Selecting the highest-risk 20% for screening identified 55.6% of frailty cases in this validation group. Screening performance remained consistent across 3,284 modelling settings. Frailty remained associated with poor outcomes across predicted risk levels.
Why it matters
Frailty assessment can guide care for adults with chronic diseases as they age. The study addressed how to prioritise these assessments when screening everyone is resource-intensive.
Caveats
This observational prediction study evaluated screening in existing data, not its use in routine clinical care. The paper is a preprint and has not yet been peer-reviewed.
From the paper
- Participants
The validation set comprised 93,910 participants, including 5,461 (5.8%) participants classified as frail.
- Result
For example, in those in the top 20% of predicted frailty, frailty was significantly associated with 3-year mortality (HR 1.90, 95% CI 1.51–2.38), 10-year mortality (HR 1.91, 1.72–2.11), poor self-rated health (OR 7.17, 6.55–7.84), polypharmacy (OR 2.99, 2.75–3.25), and falls (OR 2.40, 2.21–2.60).
- Limitation
First, our model was designed to prioritize individuals for clinical frailty assessment rather than to diagnose frailty directly.
Quoted word for word from the full text on medRxiv.
The paper
Inserm; Christian-Albrechts-Universität zu Kiel
medRxiv, 7 Oct 2026, Open access, CC BY-NC-ND, Preprint, not peer-reviewed

