Four subtypes identified in metabolically unhealthy obesity
Among 43,577 UK Biobank participants with metabolically unhealthy obesity, an observational analysis identified four subtypes with different heart and kidney disease associations.
62,341 participants
Limit: Sex-related biology could explain some of the apparent metabolic subtype differences
Edited by Boris Djordjevic · AgingResearch.News
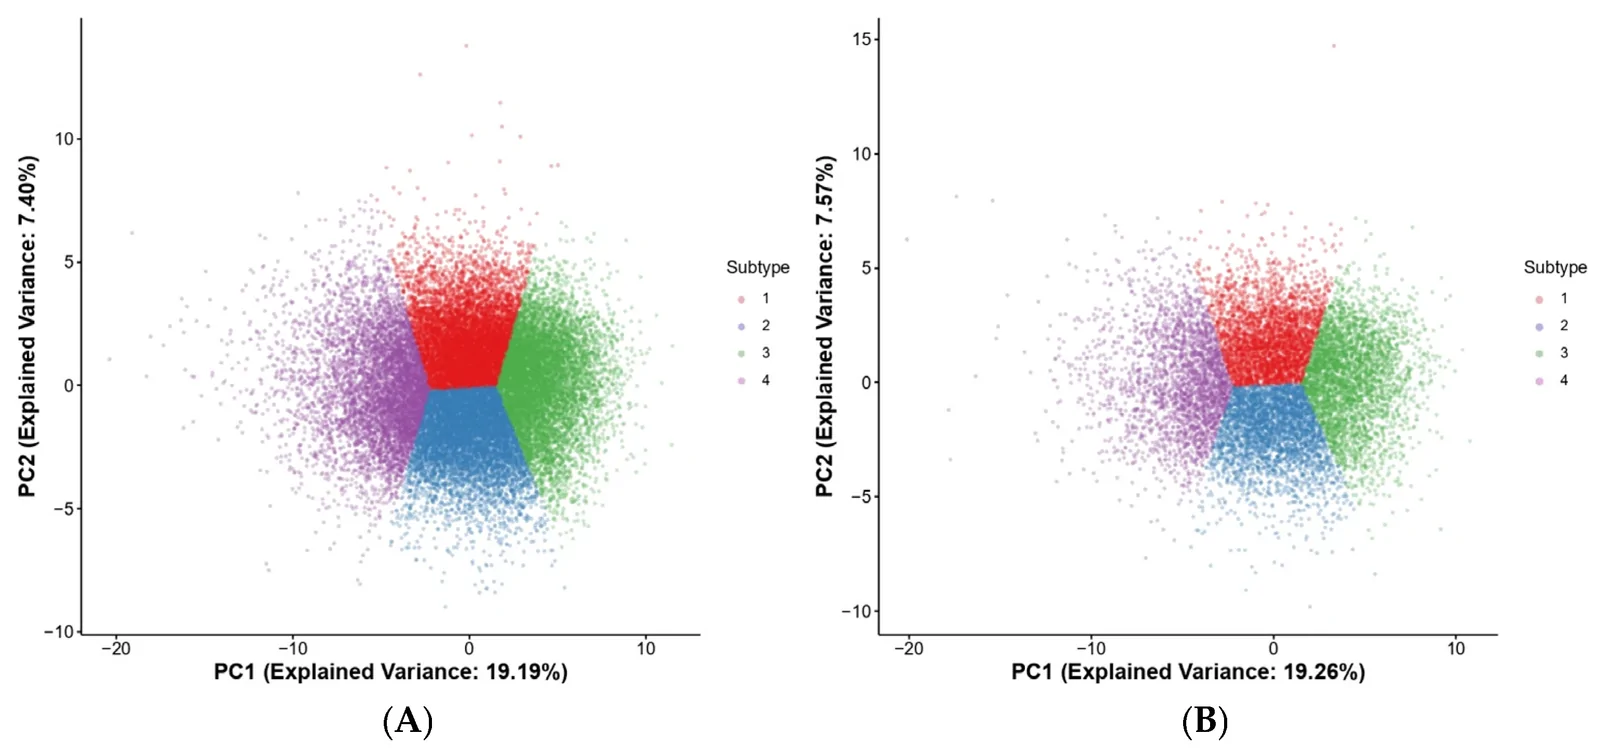
An observational analysis covered 62,341 UK Biobank participants with obesity: 43,577 classified as metabolically unhealthy and 18,764 who were not. Researchers grouped the metabolically unhealthy participants into four subtypes using 67 blood measures. The subtypes differed in kidney-related measures, blood fats and amino acids, the building blocks of proteins.
Over a median 14.81 years, subtypes II and IV were linked to higher coronary heart disease risk than in participants not classified as metabolically unhealthy. Hazard ratios—relative measures of risk over time—were 1.34 and 1.37, respectively. Subtype IV was linked to lower risk of atrial fibrillation, an irregular heartbeat, with a hazard ratio of 0.73. Subtype III was linked to higher heart failure risk, with a hazard ratio of 1.42. Subtype I was linked to higher chronic kidney disease risk, with a hazard ratio of 1.52.
Why it matters
Heart and kidney diseases matter for health in later life. The findings suggest that conventional criteria for metabolic syndrome, a cluster of metabolic risk factors, may not fully capture differences within metabolically unhealthy obesity.
Caveats
The observational design cannot show that the subtypes caused the differences in disease risk. The analysis involved UK Biobank participants with obesity, not people without obesity.
From the paper
- Participants
After excluding participants with missing metabolomic or key laboratory data and those with a BMI < 30 kg/m, 62,341 individuals were included and randomly split into a 70% training set (n = 43,639) and a 30% validation set (n = 18,702) (Supplemental Figure S1).
- Follow-up
With a median follow-up of 14.81 years (Q1–Q3: 13.95–15.58), Kaplan–Meier curves showed marked differences in the cumulative incidence of these events among the four metabolic subtypes and non-MUO individuals (Figure 3).
- Result
CHD: Subtype IV showed a positive association with CHD (HR 1.37, 95% CI 1.15–1.64, p < 0.001; PFDR = 0.011), followed by Subtype II (HR 1.34, 95% CI 1.11–1.61, p = 0.002; PFDR = 0.024); both associations remained significant after FDR correction.
Quoted word for word from the full text on mdpi.com.
- Amino acid metabolism
- Lipid and ceramide metabolism
- Metabolically unhealthy obesity
- Obesity
- Coronary heart disease
- Humans
The paper
Metabolically Unhealthy Obesity: Novel Subtypes Defined by Integrated Metabolomics and Hematology
Fujian Medical University
Biomedicines, Oct 16, 2026, Open access