Lower blood index linked to higher risk of vein clots
Participants in the highest versus lowest quarter of the blood index had a hazard ratio of 0.77 for vein clots, a relative measure of risk.
Dose-response
Limit: Vein clots were identified using diagnostic codes, which can misclassify cases
Edited by Boris Djordjevic · AgingResearch.News
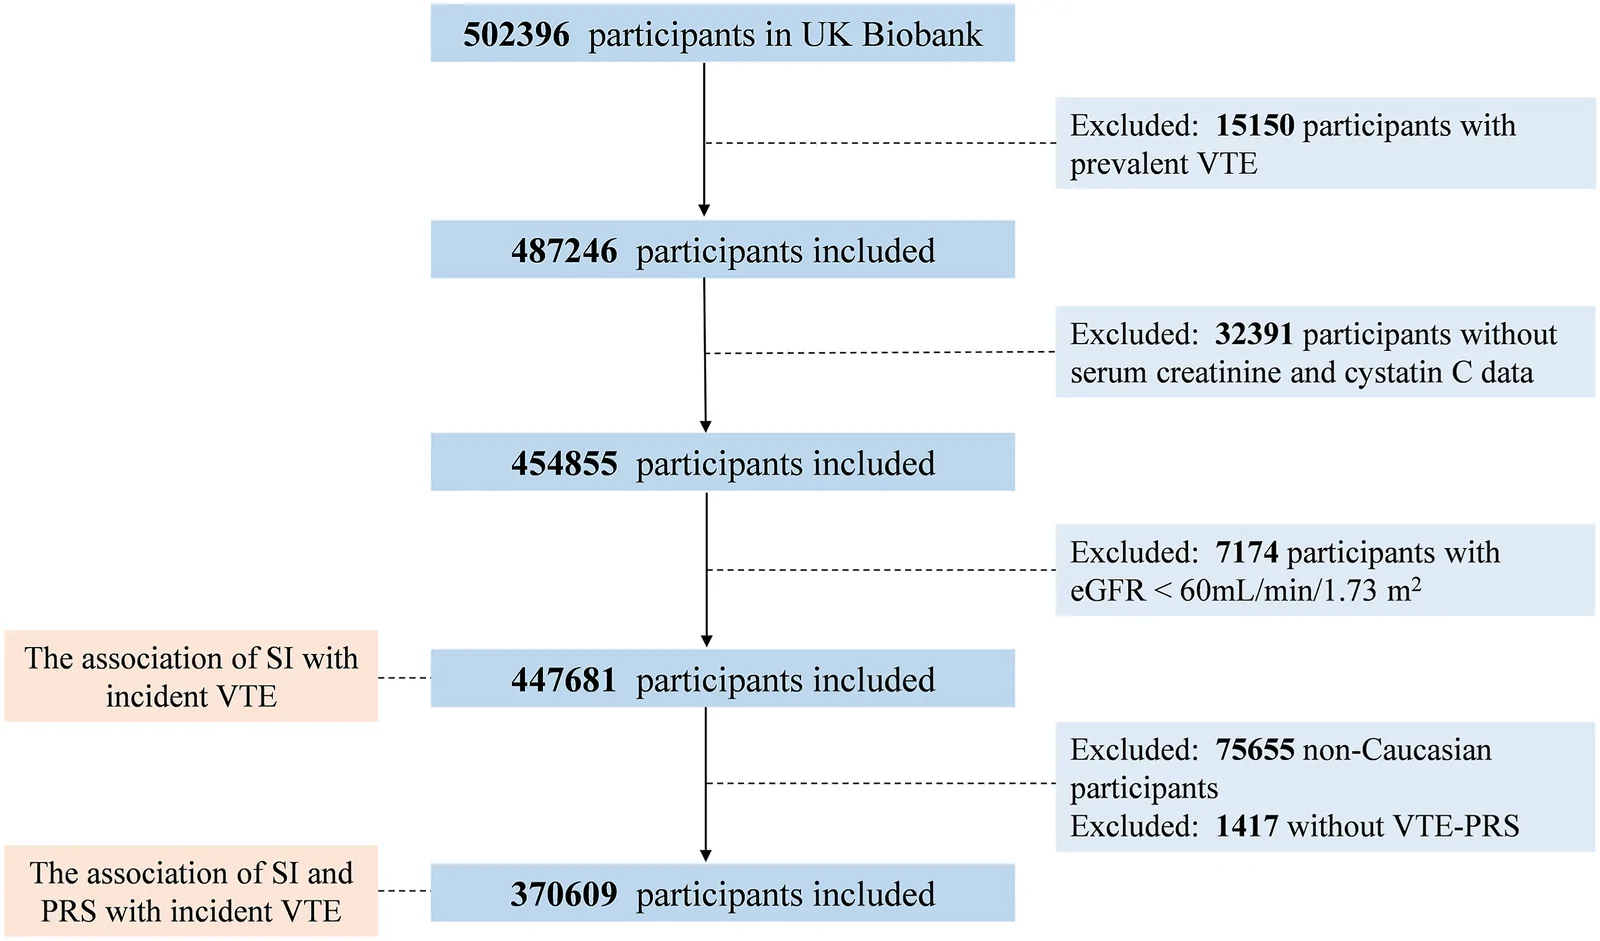
An observational cohort study examined 447,681 UK Biobank participants for links between a blood-based index, genetic susceptibility and venous thromboembolism—blood clots in veins. Researchers calculated the sarcopenia index from the ratio of creatinine, a waste product, to cystatin C, a protein, in blood. Over a median 13.4 years, 12,008 participants developed these clots.
After adjustment for other factors, participants in the highest quarter of the index had a hazard ratio of 0.77 compared with the lowest quarter. This relative measure indicates lower risk when below 1. Participants with both a low index and high genetic risk had a hazard ratio of 3.60 compared with those with a high index and low genetic risk.
Why it matters
The index takes its name from sarcopenia, the loss of muscle mass and strength with age. The researchers suggested it may offer a simple, accessible marker for identifying people at elevated risk of vein clots.
Caveats
This observational study cannot establish cause and effect. It did not test whether preventing muscle loss or changing the blood index reduces clot risk.
From the paper
- Participants
Among the 447,681 participants included in the analysis, 12,008 incident VTE events occurred during a median follow-up period of 13.4 years.
- Follow-up
A total of 12,008 VTE events were identified during a median follow-up of 13.4 years.
- Result
After adjustment for age and sex (model 1), using Q1 as the reference, VTE risk decreased by 24%, 33%, and 42% across increasing SI quartiles (Q2-Q4), corresponding to HRs of 0.76 (95% CI, 0.72-0.80), 0.67 (95% CI, 0.63-0.70), and 0.58 (95% CI, 0.55-0.62), respectively.
Quoted word for word from the full text on PubMed Central.
The paper
Wuhan Union Hospital
Research and Practice in Thrombosis and Haemostasis, Sep 18, 2026, Open access


