US Parkinson’s death rate showed no clear long-term trend
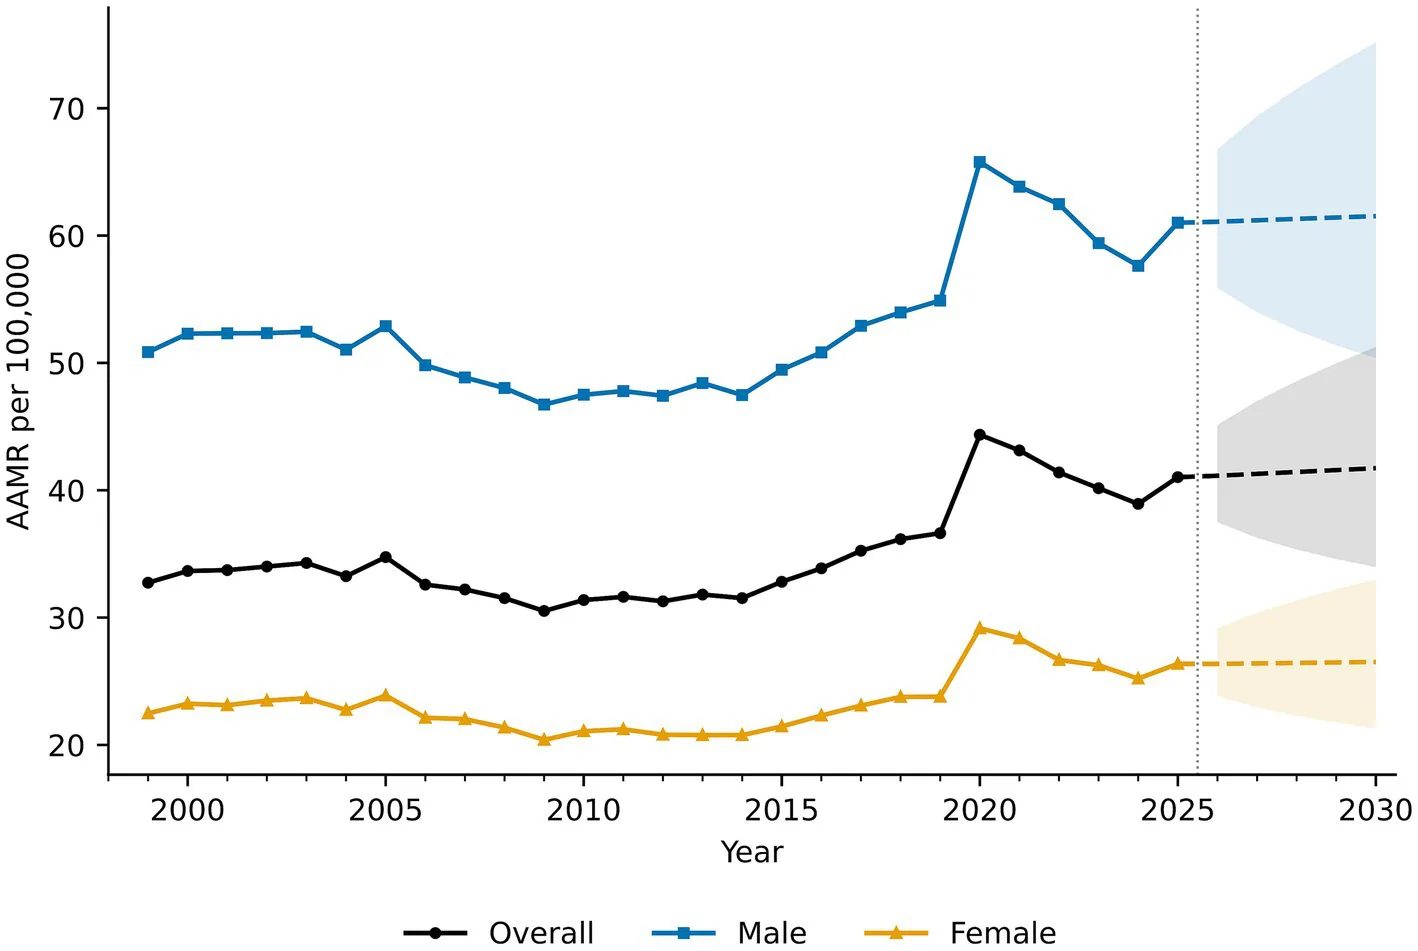
After accounting for age, Parkinson’s-related mortality was 32.74 per 100,000 in 1999 and 41.03 in 2025, without a statistically significant trend.
Limit: Changing Parkinson's recognition can distort death-certificate mortality trends
In US adults aged 45 and older, an observational study of death certificates identified 1,149,731 deaths mentioning Parkinson’s disease from 1999 to 2025. Researchers analyzed repeated snapshots of death records, compared rates adjusted for age differences, and modeled projections through 2030. The full-period trend was not statistically significant. A sharp rise from 2014 to 2021 preceded a decline that was also not statistically significant.
The researchers attributed most of the post-2021 decline to fewer death certificates also listing COVID-19, rather than improved underlying mortality. Their model projected a roughly unchanged age-adjusted rate by 2030, but annual deaths rising from 62,162 in 2025 to 70,825 in 2030. It attributed approximately 87% of that projected increase to population aging.
Why it matters
Parkinson’s disease contributes to late-life disability and death. Distinguishing changing mortality rates from population aging can help frame future care needs.
Caveats
This death-certificate analysis counted mentions of Parkinson’s disease, not necessarily the primary cause of death. It covered US adults aged 45 and older; the 2030 figures are projections, not observed outcomes.
From the paper
- Result
Joinpoint analysis identified a significant decline from 1999 to 2014 (APC −0.65%; 95% CI −1.16 to −0.14; p = 0.015), a steep and highly significant increase from 2014 to 2021 (APC 4.70%; 2.95 to 6.48; p < 0.001) …
- Limitation
This analysis relied on death-certificate coding; estimates may be influenced by diagnostic accuracy, certification practice, coding conventions, and changing awareness over time.
Quoted word for word from the full text on frontiersin.org.
The paper
College of Medicine
Frontiers in Neurology, Oct 1, 2026