Postpartum Blood Pressure After Hypertensive Disorders of Pregnancy and Subsequent Cardiovascular Disease: A Population-Based Cohort Study
Abstract
OBJECTIVE: To assess the association between blood pressure values at 6 weeks postpartum and subsequent cardiovascular disease (CVD) over a 20-year period among women with hypertensive disorders of pregnancy (HDP). DESIGN: Population-based cohort study. SETTING: English primary and secondary care data, linked to cause-specific mortality records from 2000 to 2020. POPULATION: A cohort of 39 934 women between 15 and 49 years of age at birth who had HDP, were registered with a general practitioner (GP) contributing to the Clinical Practice Research Datalink (CPRD), and eligible for linkage to hospital episode statistics (HES) data were included. We excluded 22 100 (55.3%) women with no blood pressure values recorded at 6 weeks postpartum. METHODS: Primary analysis included multivariable Cox regression modelling (weighted by the inverse probability of having a severe HDP). MAIN OUTCOME MEASURE: Validated composite outcome of 12 cardiovascular diseases. RESULTS: The rate for incident cardiovascular events was 109 per 10 000 person-years; 794 (68%) of them occurred in women aged < 40 years. Women with abnormal blood pressure at 6 weeks postpartum had a higher risk of subsequent CVD than women with normal blood pressure: 10.9% vs. 5.4% - adjusted hazard ratio 1.96 (95% CI 1.51-2.54). CONCLUSIONS: Less than half of women with HDP had a blood pressure record in their GP notes at 6 weeks postpartum. The absence of a record of normal blood pressure at this time point was associated with an increased risk for subsequent CVD The immediate postpartum period may be a crucial window in preventive care to improve women's health.
From the paper
- Participants
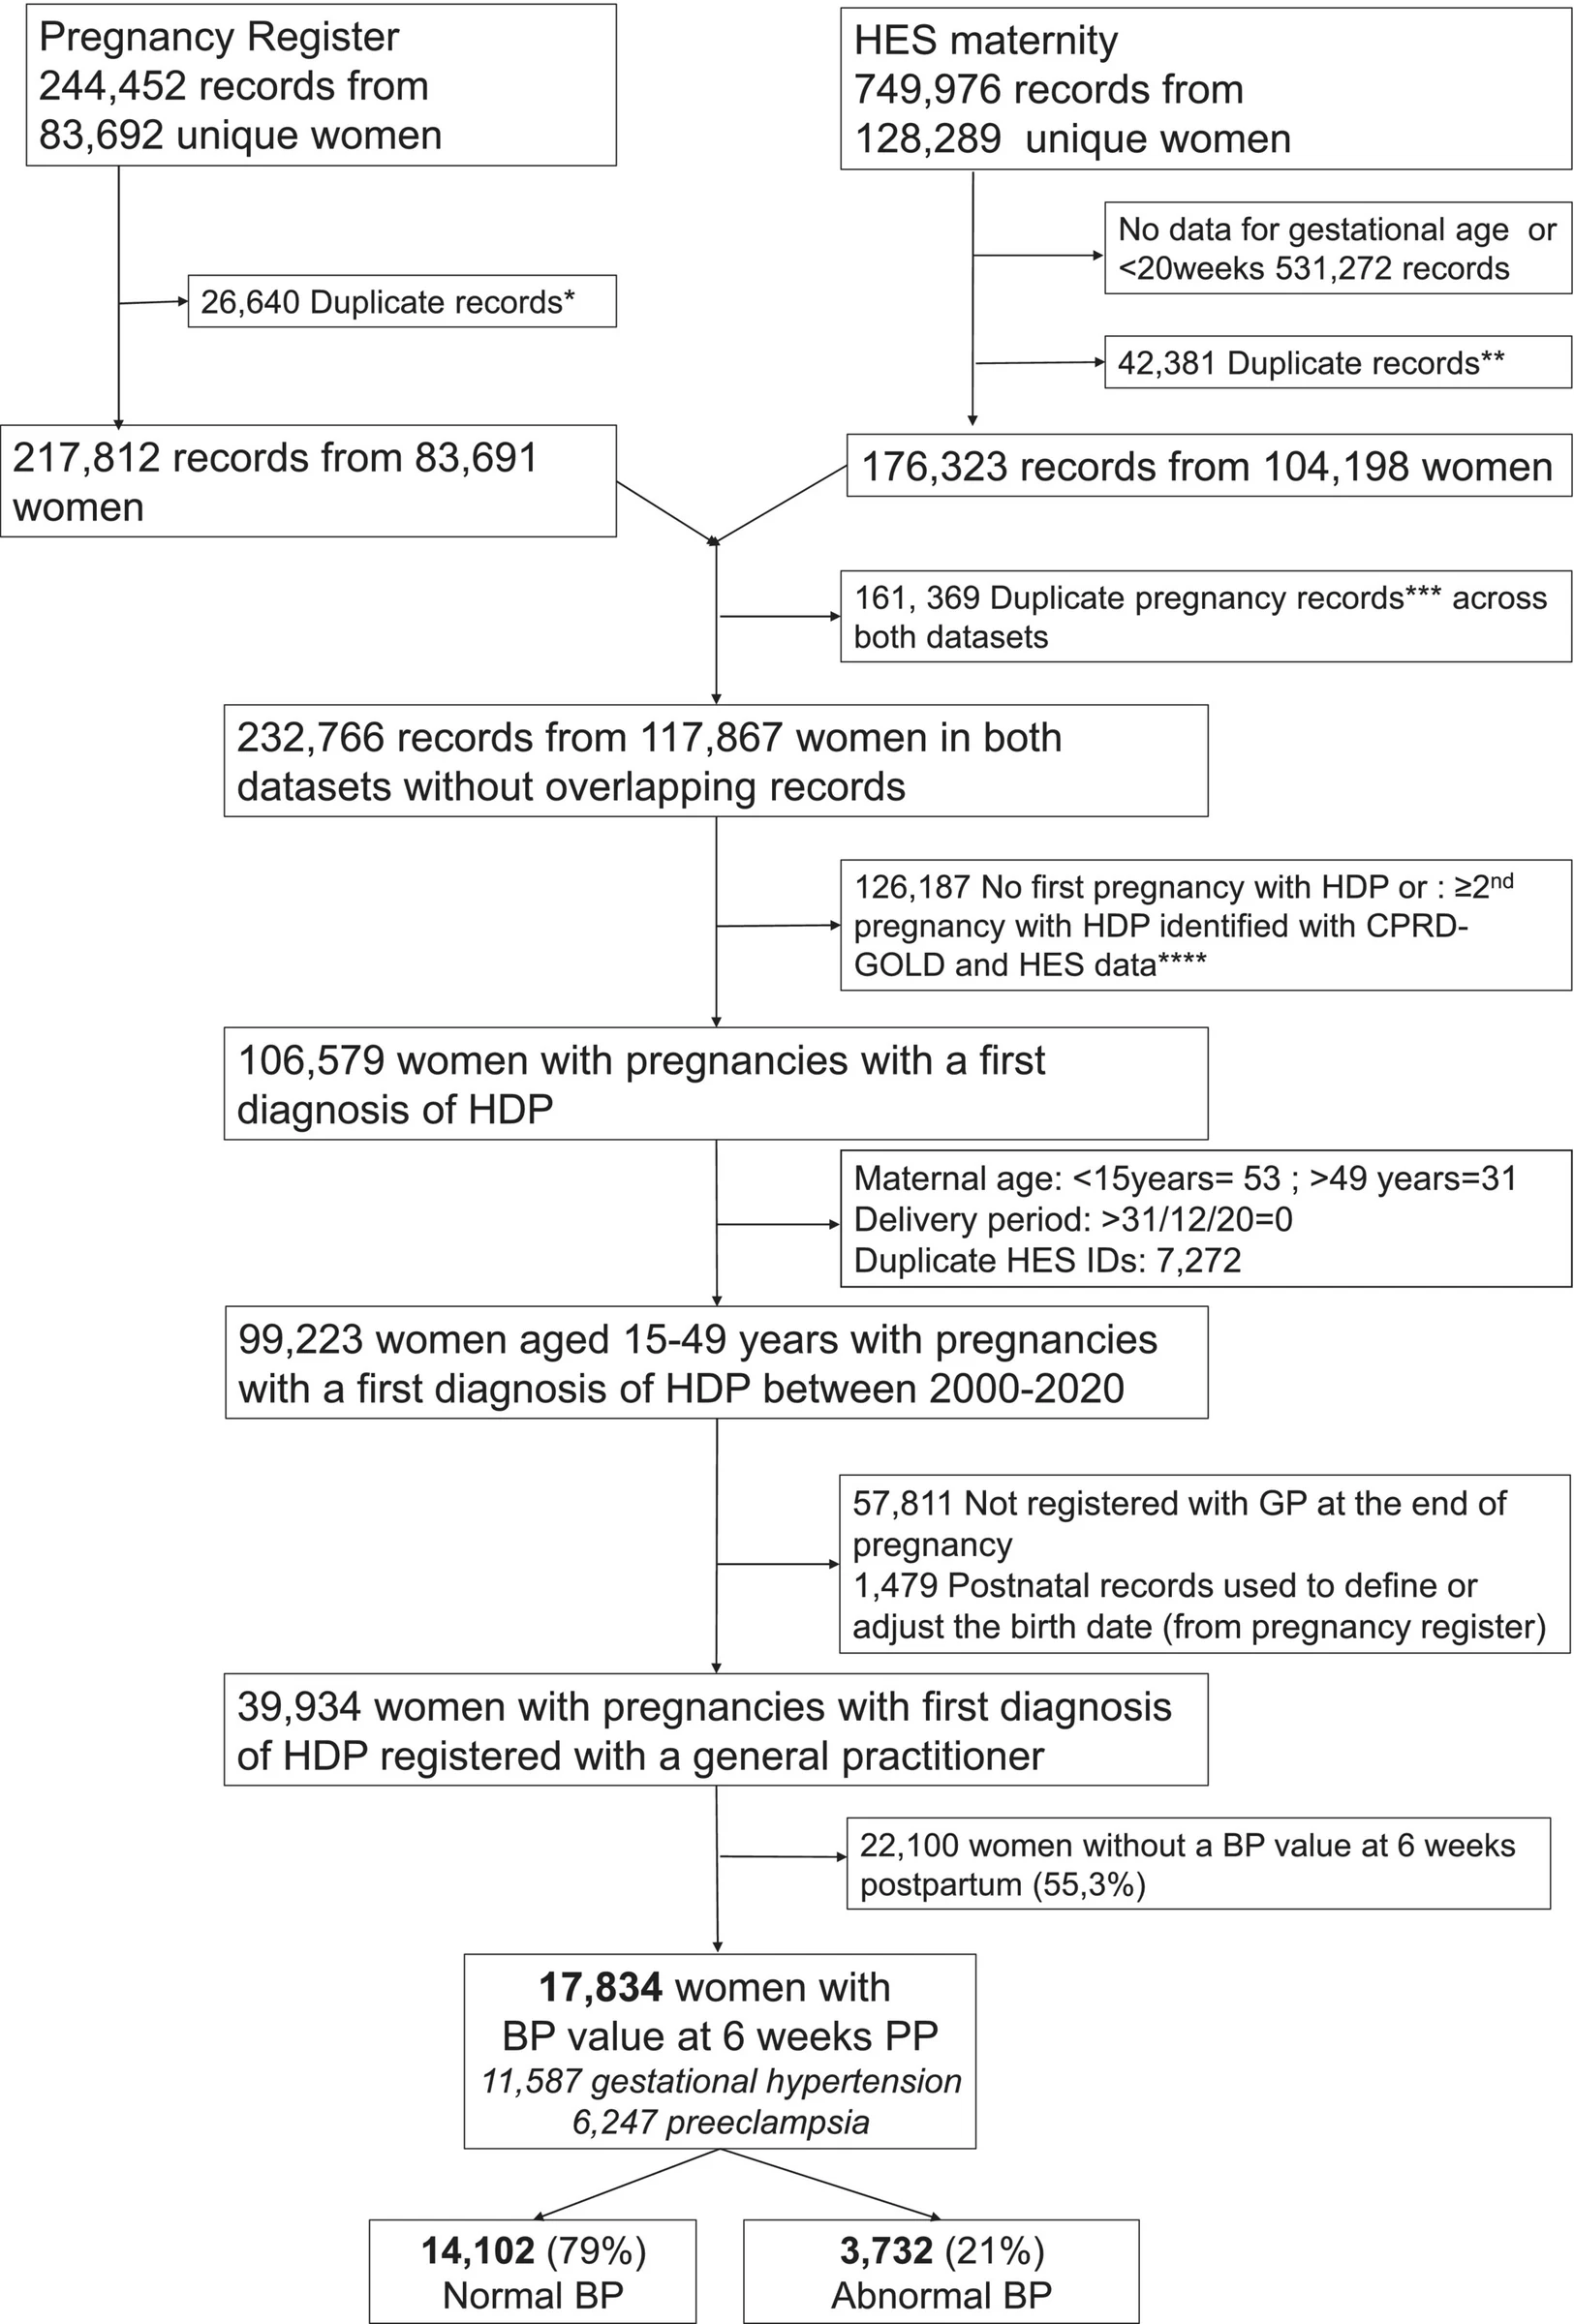
The analytic sample consisted of 39 934 women (Figure 1): 22 100 (55.3%) with no reported BP value at 6 weeks.
- Result
Women with abnormal blood pressure at 6 weeks postpartum had a higher risk of subsequent CVD than women with normal blood pressure: 10.9% vs. 5.4% - adjusted hazard ratio 1.96 (95% CI 1.51–2.54).
- Events by group
The proportion of CVD in the abnormal BP value group was approximately two times more than in the normal BP value group (10.9% vs. 5.4% at 6 weeks) (Table 2), and the rate of onset of CVD was higher in the abnormal BP value group (Figure 2).
Quoted word for word from the full text on obgyn.onlinelibrary.wiley.com.
The paper
Inserm; Nuffield Department of Women's and Reproductive e Health University of Oxford
BJOG, Oct 16, 2026, Open access


