Association between fear states and cognitive impairment: A cross-sectional observational study based on the China Health and Retirement Longitudinal Study (CHARLS)
Abstract
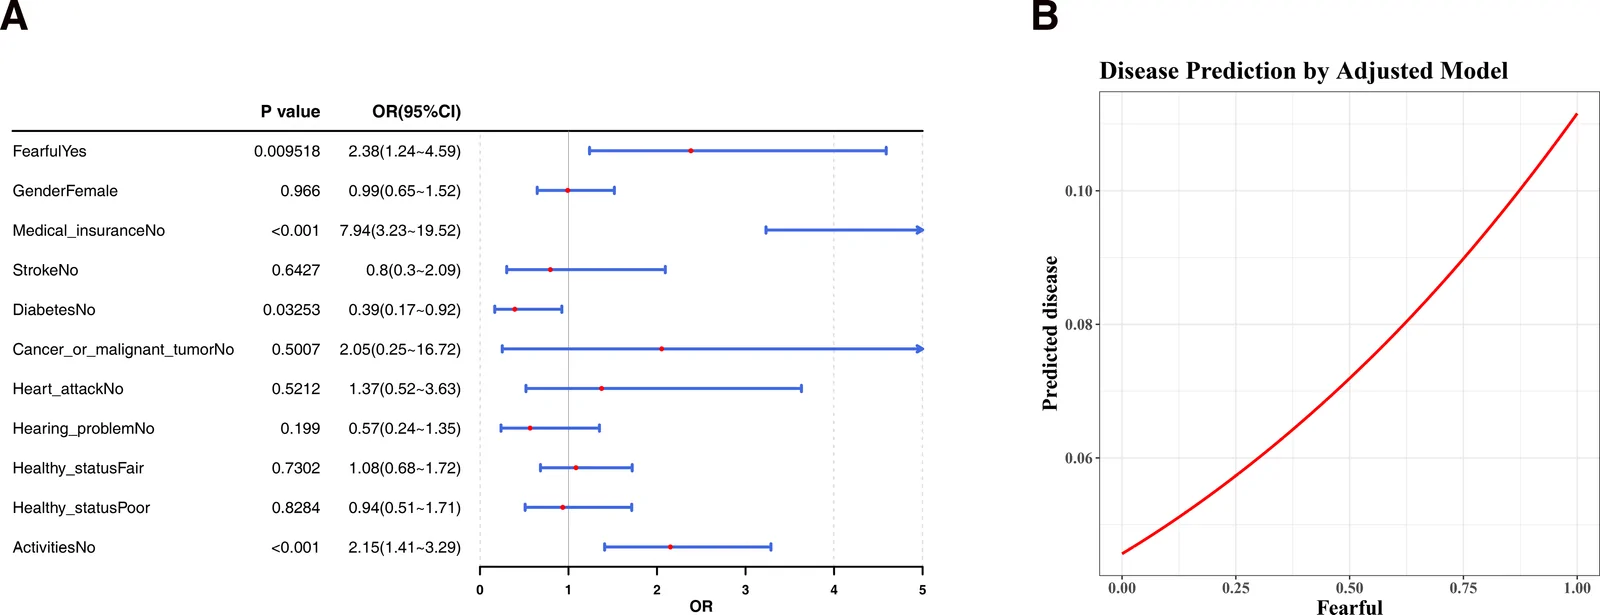
As global populations age, the prevalence of cognitive impairment continues to rise, increasing the burden on families and society. This study examined the relationship between anxiety and cognitive function. Using nationally representative data from China Health and Retirement Longitudinal Study (CHARLS), this observational cohort study evaluated the association between fear states and cognitive impairment to provide objective scientific evidence on the potential causes of cognitive decline and to inform early prevention and treatment strategies. In this study, the prevalence of cognitive impairment was significantly higher among participants in the fearful group. After adjustment for multiple covariates, fearful state remained independently associated with cognitive impairment (odds ratio = 2.38, 95% confidence interval = 1.24-4.59, P = 9.52 × 10⁻³). Smooth curve fitting additionally confirmed this positive association. These findings demonstrate a significant association between fear state and cognitive impairment, highlighting the need to consider emotional well-being in cognitive health assessments.
From the paper
- Participants
Ultimately, 2001 participants were included in the cohort analysis.
- Result
… Model I: P = 3.35 × 10⁻³, OR = 2.63, 95% confidence interval = 1.38–5.01; Model II: P = 4.24 × 10⁻³, OR = 2.58, 95% confidence interval = 1.35–4.92; Model III: P = 9.52 × 10⁻³, OR = 2.38, 95% confidence interval = 1.24–4.59; Table and Fig. A).
- Limitation
First, the exposure variable “fear state” was measured using a single self-report item (dc014) and dichotomized into fear and non-fear categories.
Quoted word for word from the full text on PubMed Central.
The paper
Wuwei People’s Hospital; Gansu Provincial Hospital of TCM
Medicine, 11 Sep 2026, Open access