Frailty and depressive symptoms linked to rising disease burden
Disease-burden scores rose 0.203 points per year more in adults with frailty and depressive symptoms at both surveys than in those with neither.
Our read
Populations- Studied:
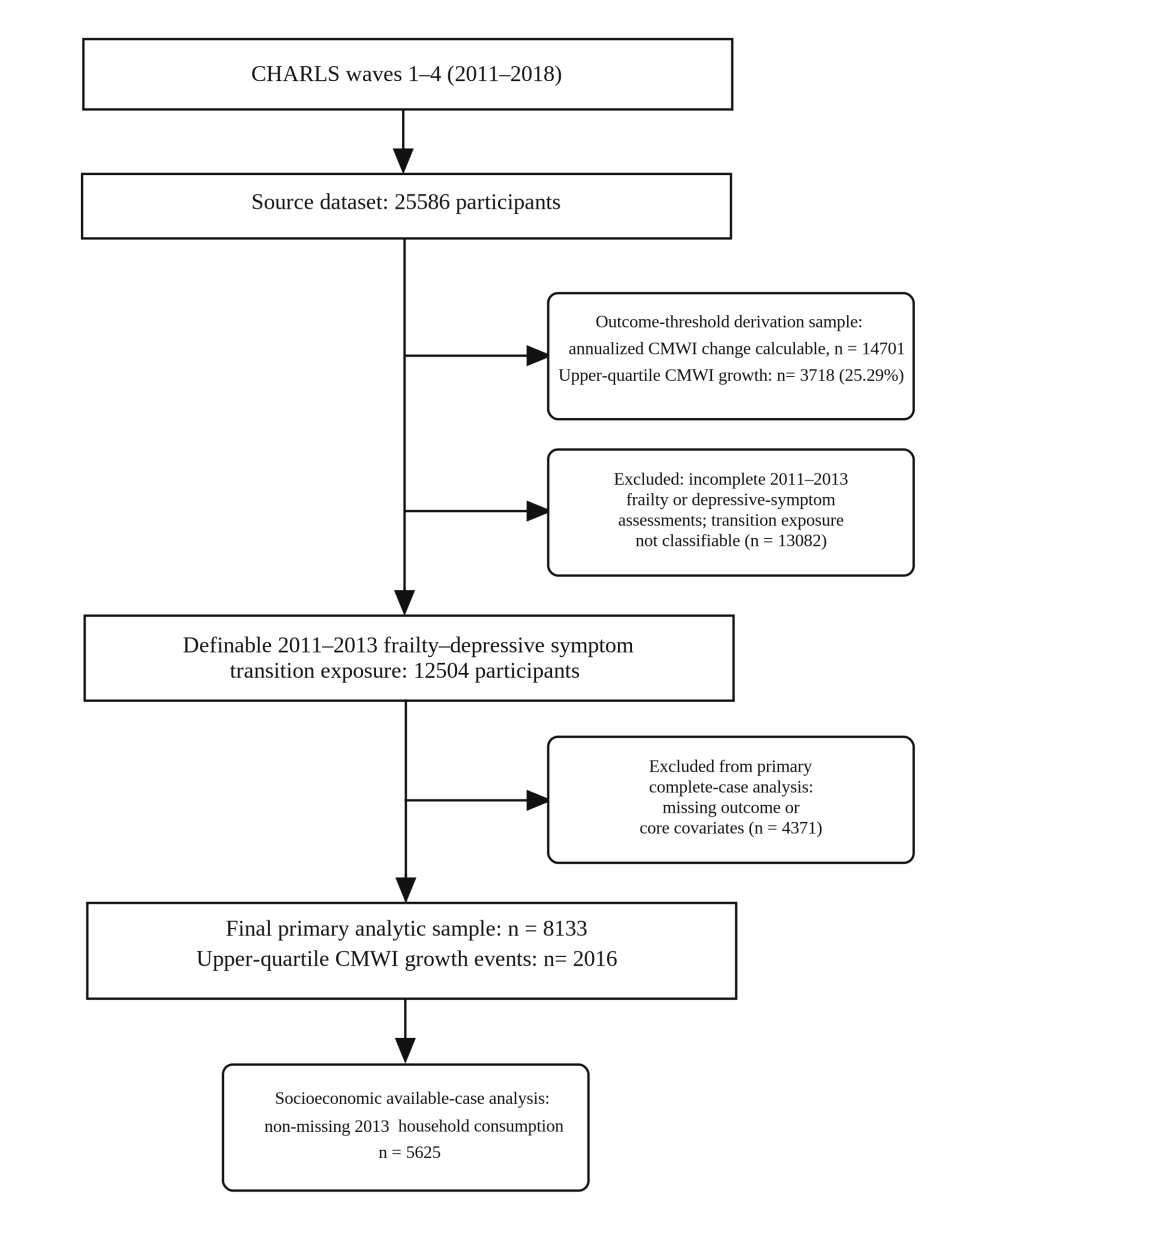
- Preprint: cohort study of 8,133 people
Editor of record: Boris Djordjevic · AgingResearch.News
Among 8,133 Chinese adults aged 45 and older, an observational cohort analysis compared frailty and depressive symptoms recorded in 2011 and 2013 with changes in chronic disease burden during 2013–2018. Researchers scored 14 chronic conditions according to their effects on physical function.
Adults with both frailty and depressive symptoms at both surveys had the largest subsequent increase compared with those with neither at both surveys. After adjustment for factors including age and sex, their scores rose 0.203 points per year more. Their adjusted risk of being in the highest quarter of score increases was 20.5 percentage points higher over 2013–2018. Having both frailty and depressive symptoms at both surveys was concentrated among people with lower household spending. Rapid score growth showed no clear socioeconomic concentration.
Why it matters
Frailty and depressive symptoms often coexist in middle-aged and older adults. The authors suggest assessing both may help identify people at risk of increasing chronic disease burden.
Caveats
Health differences not captured by the adjustments could contribute to both frailty with depressive symptoms and later disease burden. The analysis included only people with complete records, potentially missing differences among those who died or dropped out; this preprint has not been peer-reviewed.
From the paper
- Participants
Among 8,133 participants, 2,016 (24.8%) had upper-quartile CMWI growth.
- Result
In primary Model A, persistent dual vulnerability showed the largest mean difference in annualized CMWI change compared with stable low risk (0.203 points/year, 95% CI 0.155–0.252) and the highest risk ratio for upper-quartile growth (RR 2.15, 95% CI 1.88–2.46).
- Absolute difference
Model A marginal standardization gave an adjusted absolute risk difference of 20.5 percentage points (95% CI 16.4–24.6).
Quoted word for word from the full text on researchsquare.com.
The paper
Huazhong University of Science and Technology
Research Square, Nov 5, 2026, Open access, Preprint, not yet peer-reviewed

Comments
Be the first to comment.