Retinal measurements helped predict cancer in UK cohort
People classified as high risk from retinal measurements had nearly threefold higher cancer risk over 12 years than those classified as low risk.
Limit: Choosing eyes with higher vessel density could bias predictions using that same retinal feature
Edited by Boris Djordjevic · AgingResearch.News
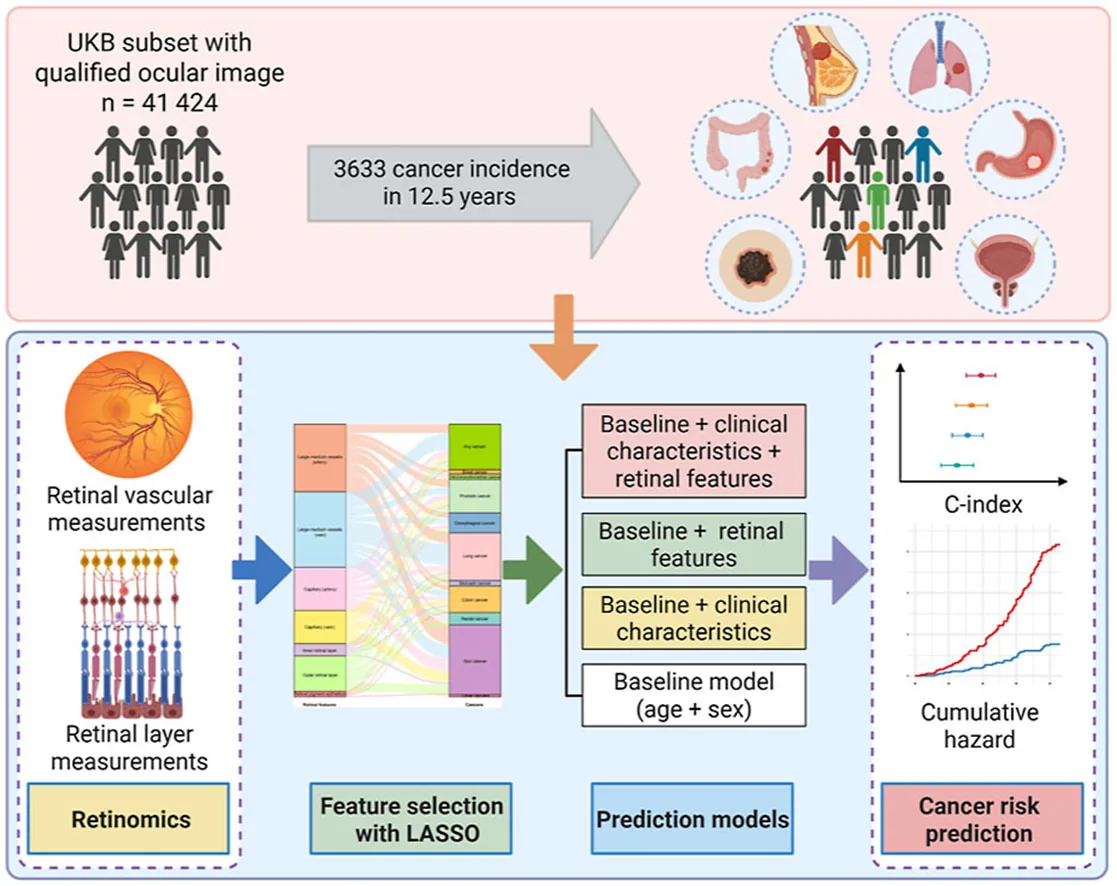
A prospective observational cohort study analyzed eye photographs and retinal scans from 41,424 UK Biobank participants. Researchers extracted 156 measurements of the retina, the light-sensitive tissue at the back of the eye. They tested whether adding these measurements to models using age, sex, ethnicity and lifestyle factors improved predictions of later cancer diagnoses.
Over 12.5 years, 3,633 participants (8.77%) developed cancer. Adding retinal measurements improved prediction across most cancer types. Predicted and observed risks generally agreed. The largest improvement was for uterine or endometrial cancer, but only 20 participants developed that cancer, so the authors urged caution.
Why it matters
For cancer prevention in later life, a key question is whether noninvasive measurements can help identify people who warrant closer risk assessment before diagnosis.
Caveats
This observational study assessed prediction, not whether retinal features cause cancer or whether eye-based risk profiling prevents it. The results came from UK Biobank participants with eligible retinal photographs and scans.
From the paper
- Participants
A total of 41 424 participants were included in the analysis, with a median follow-up duration of 12.5 years.
- Result
For any cancer, the HR was 1.07 (95% CI: 1.06–1.08; P < 0.001).
Quoted word for word from the full text on PubMed Central.
The paper
Hong Kong Polytechnic University
Ophthalmology Science, Sep 21, 2026, Open access


