Associations of temperature, particulate matter, and greenness with human papillomavirus positivity at screening: an analysis of Guangdong Province (2016-2022) using the treed distributed lag nonlinear model
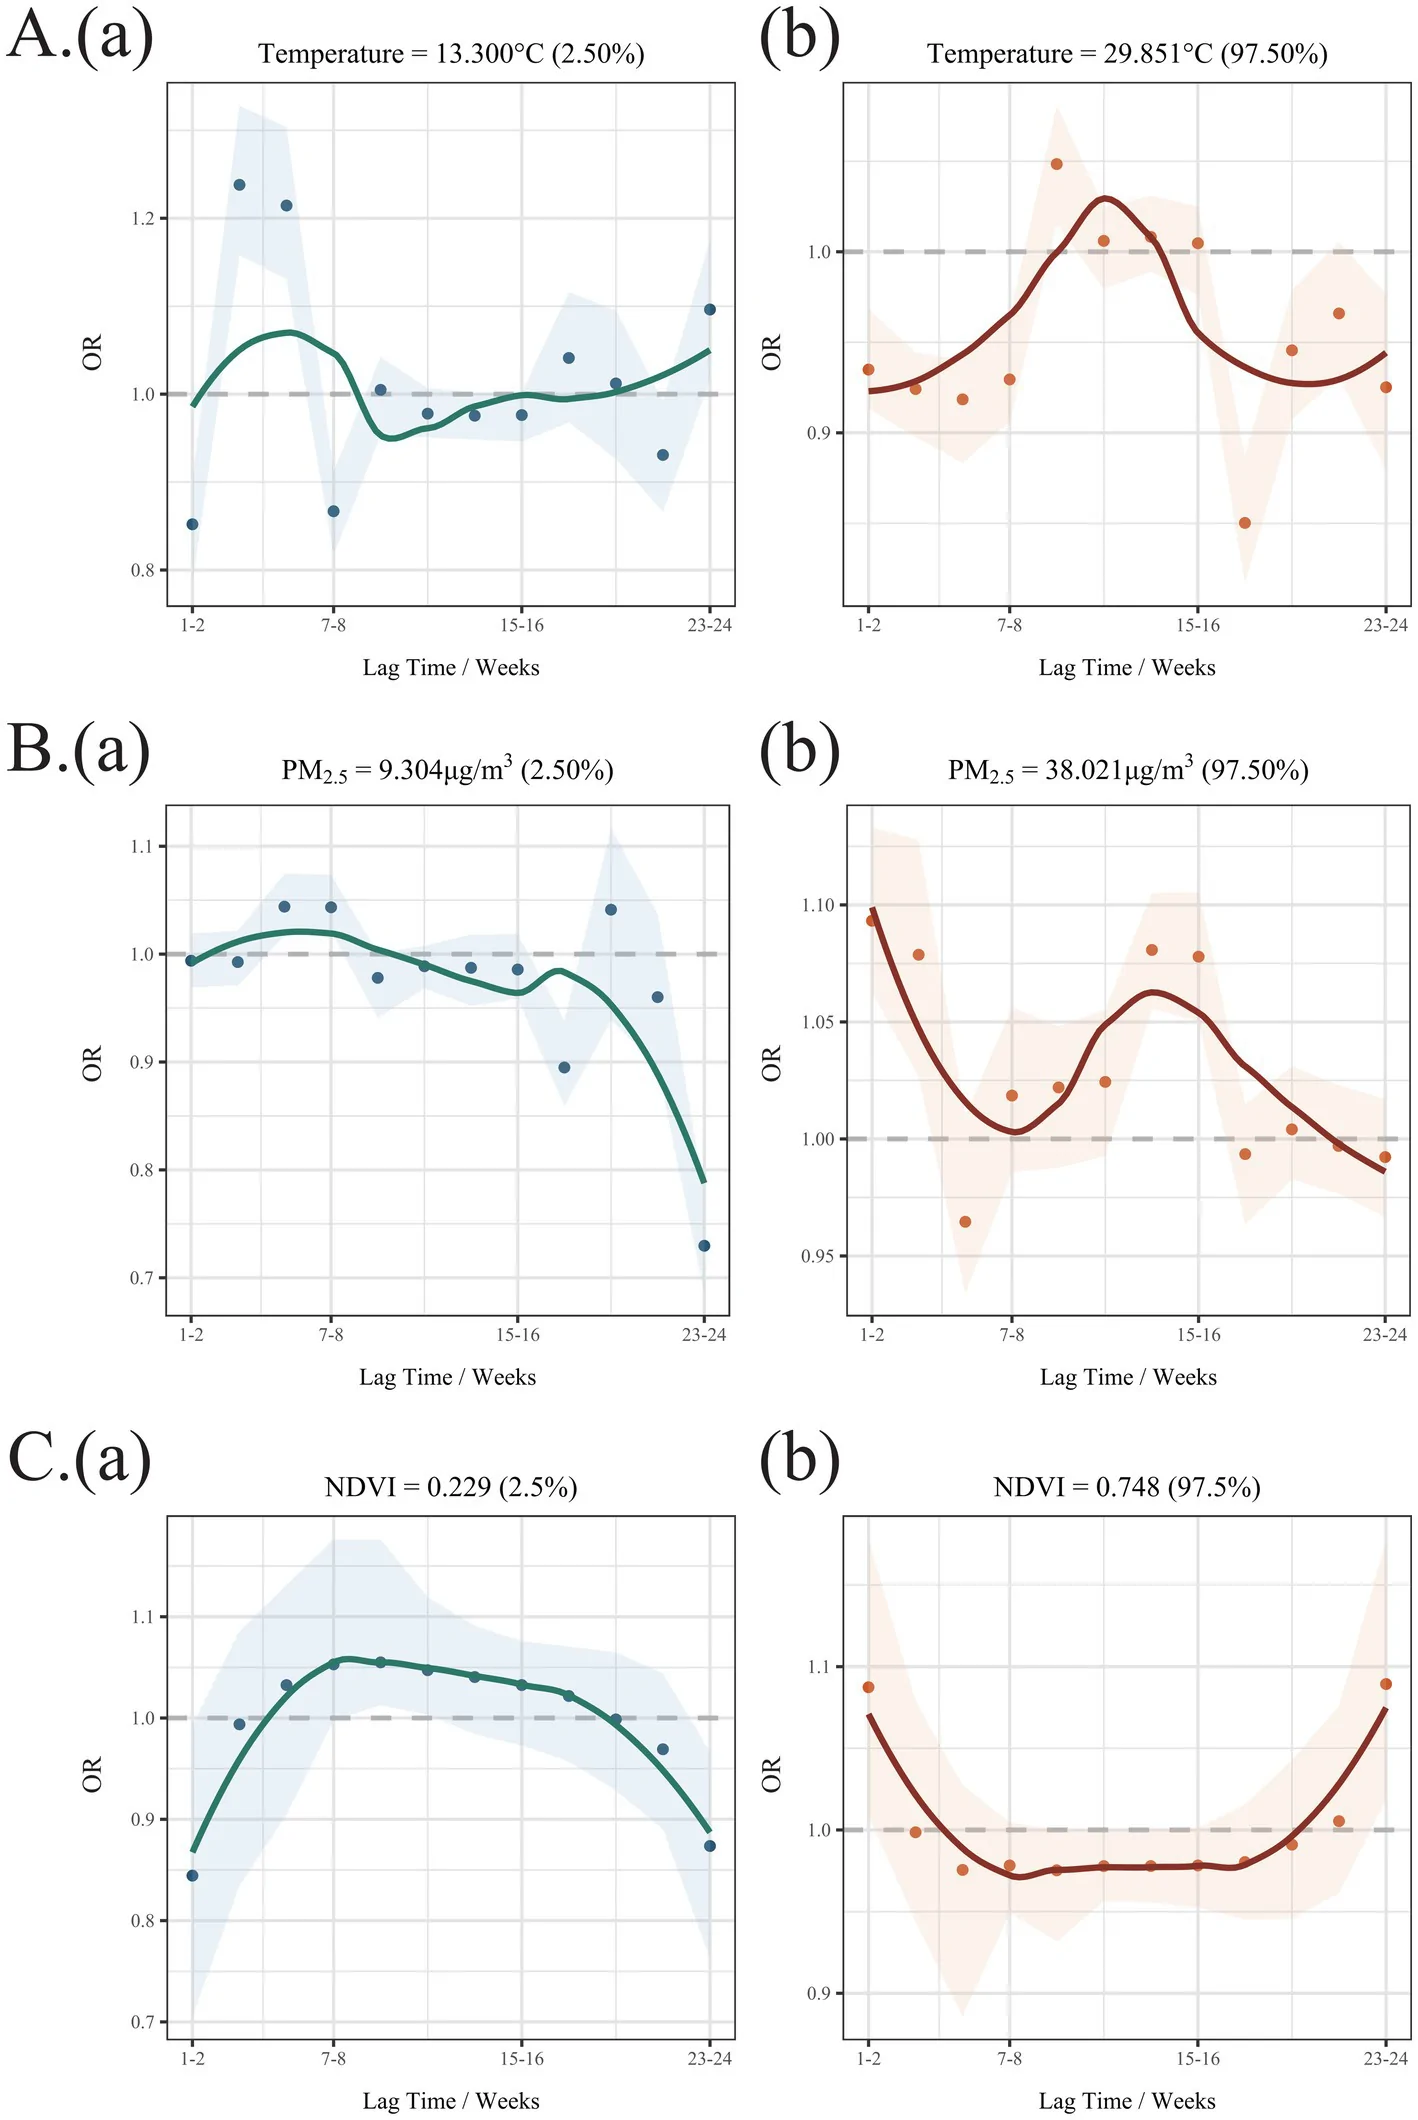
Figure 1. Lag-response curves for the associations of biweekly mean temperature, PM2.5 concentration, and NDVI with HPV positivity at screening.
Open the figure at full size
Figure 1. Lag-response curves for the associations of biweekly mean temperature, PM2.5 concentration, and NDVI with HPV positivity at screening.Lag-response curves for the associations of biweekly mean temperature, PM2.5 concentration, and NDVI with HPV positivity at screening.Hong et al.

Frontiers in Public Health

The paper

Hong X, You ZM, Wu L et al.

Frontiers in Public Health · 9 Sep 2026

doi.org/10.3389/fpubh.2026.1842611PubMed 42780692