GeoHealth

Impact of Climate Warming on All-Causes Mortality in China: The Role of Non-Optimal Temperature Exposure and Multi-Scenario Projections to 2050
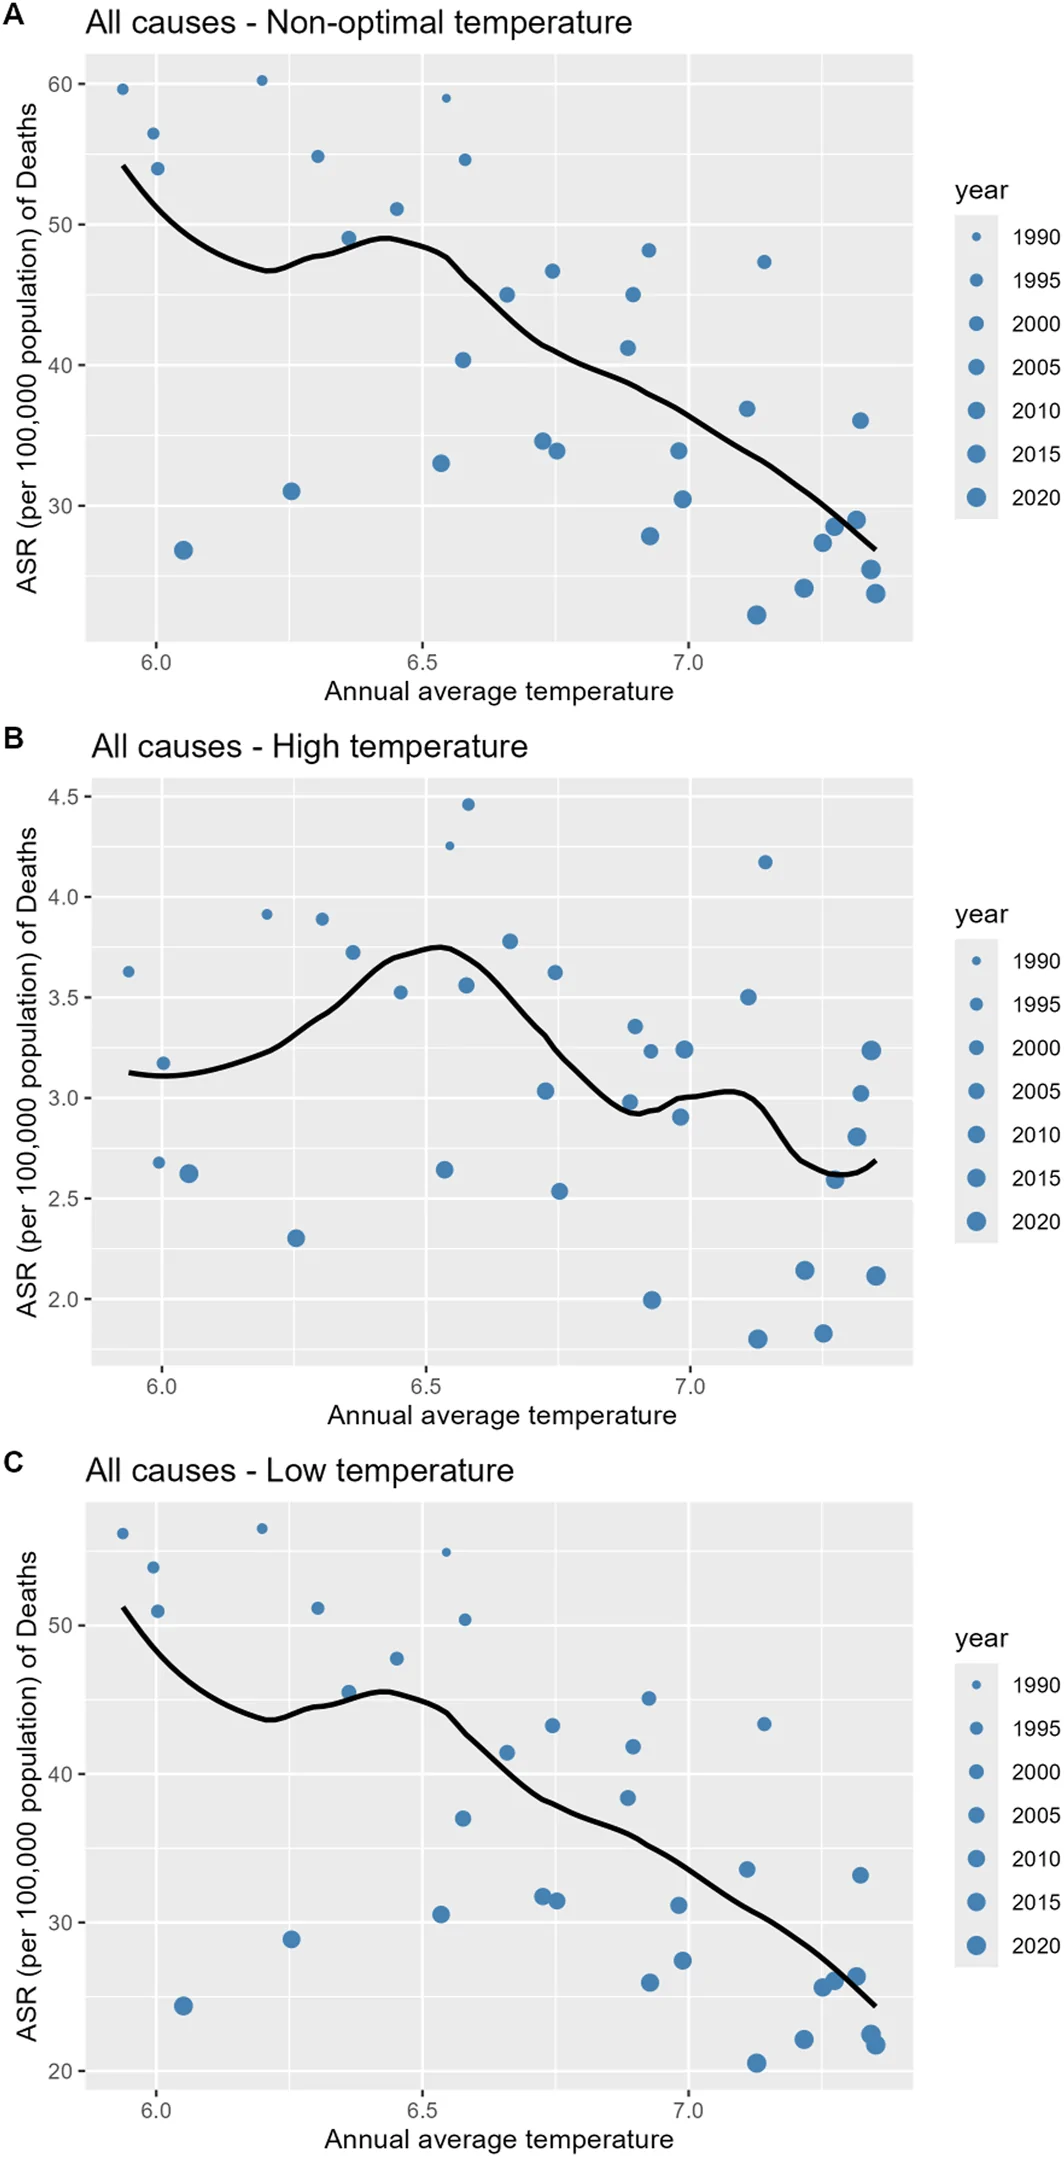
Figure 1. Correlation between the annual average temperature from CN05.1 and the age‐standardized rate of all‐causes mortality attributable to non‐optimal temperature exposure in China from 1990 to 2022.
Open the figure at full size
Figure 1. Correlation between the annual average temperature from CN05.1 and the age‐standardized rate of all‐causes mortality attributable to non‐optimal temperature…Correlation between the annual average temperature from CN05.1 and the age‐standardized rate of all‐causes mortality attributable to non‐optimal temperature exposure in China from 1990 to 2022.He et al.
Computational studyPopulations

Cohort study, declared no competing interests

The paper