Frailty linked to faster cognitive decline in adults
People classified as frail or pre-frail showed 0.023 standard deviations faster annual cognitive decline than those with low frailty scores.
Limit: Preclinical neurodegeneration could drive both frailty and later cognitive decline
Edited by Boris Djordjevic · AgingResearch.News
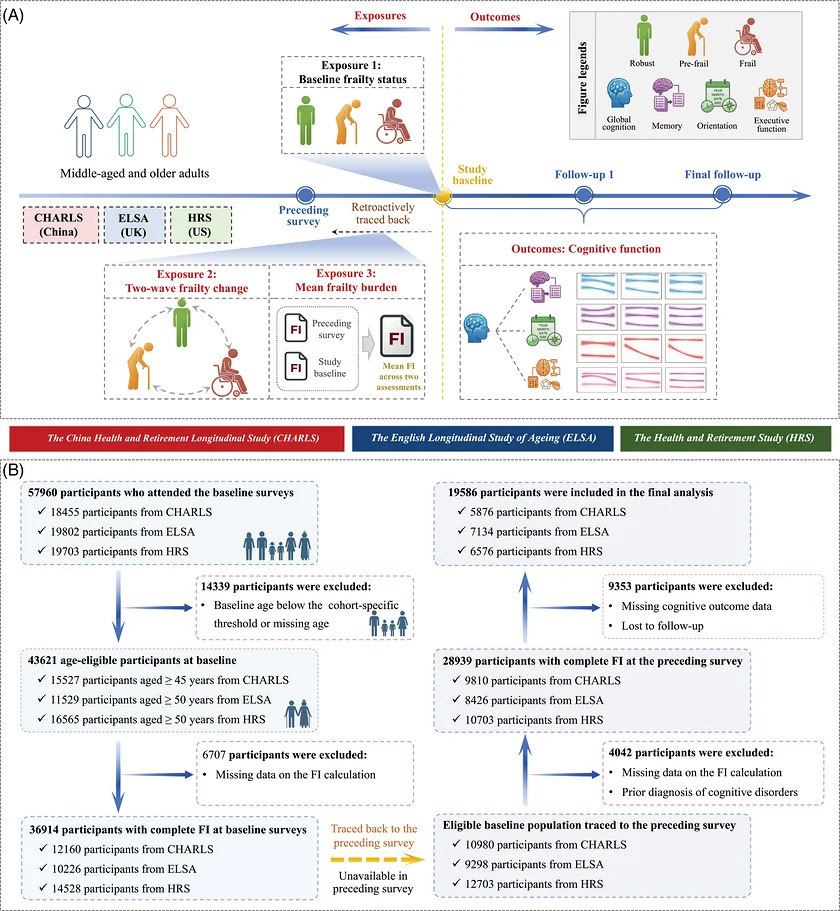
The observational study included 19,586 adults aged 45 or older in China and 50 or older in England and the US, without physician-diagnosed cognitive disorders. Researchers assessed frailty at two surveys using 28 health problems, including diseases, disability and depression. Cognitive follow-up covered 2013–2018 in China, 2014–2019 in England and 2014–2018 in the US.
Initial pre-frailty and frailty were linked to faster decline in overall cognitive scores than robust status, meaning low frailty. The differences were expressed in standard deviations, a measure of the spread of scores. Worsening from robust to pre-frail or frail status was also linked to faster decline, as was higher average frailty across the two assessments. Changes among people initially pre-frail or frail showed no clear pooled association with annual cognitive change.
Why it matters
Frailty reflects accumulated age-related health problems. The authors suggest that repeated frailty assessments may help characterize how thinking and memory change with age.
Caveats
These observational data cannot show whether reducing frailty would slow cognitive decline. The findings do not cover people with physician-diagnosed cognitive disorders or adults below the study’s country-specific age thresholds.
From the paper
- Participants
A total of 19,586 individuals were included in the final analysis: 5876 (30.0%) from CHARLS, 7134 (36.4%) from ELSA, and 6576 (33.6%) from HRS.
Results, Baseline characteristics of participants in all cohorts
- Result
Compared with robust status, baseline pre‐frailty and frailty were associated with more negative annual change in global cognition (pre‐frailty: pooled β = −0.023, 95% CI: −0.030 to −0.016, I² = 0%; frailty: pooled β = −0.023, 95% CI: −0.031 to −0.014, I² = 0%).
Results, Associations of frailty exposures with annual cognitive change
- Limitation
First, although cognitive outcomes were harmonized into comparable domains and standardized within each cohort and domain, assessment instruments differed across CHARLS, ELSA, and HRS.
Quoted word for word from the full text on PubMed Central.
The paper
Dynamic frailty exposure and cognitive aging trajectories: A multicohort study
Central South University
Alzheimer's & Dementia, Sep 2026, Open access