Research Square

A Distinct Second Spectral Peak in White Matter BOLD Signals: Mathematical Modeling, Spatial Distribution and Age-Related Evolution
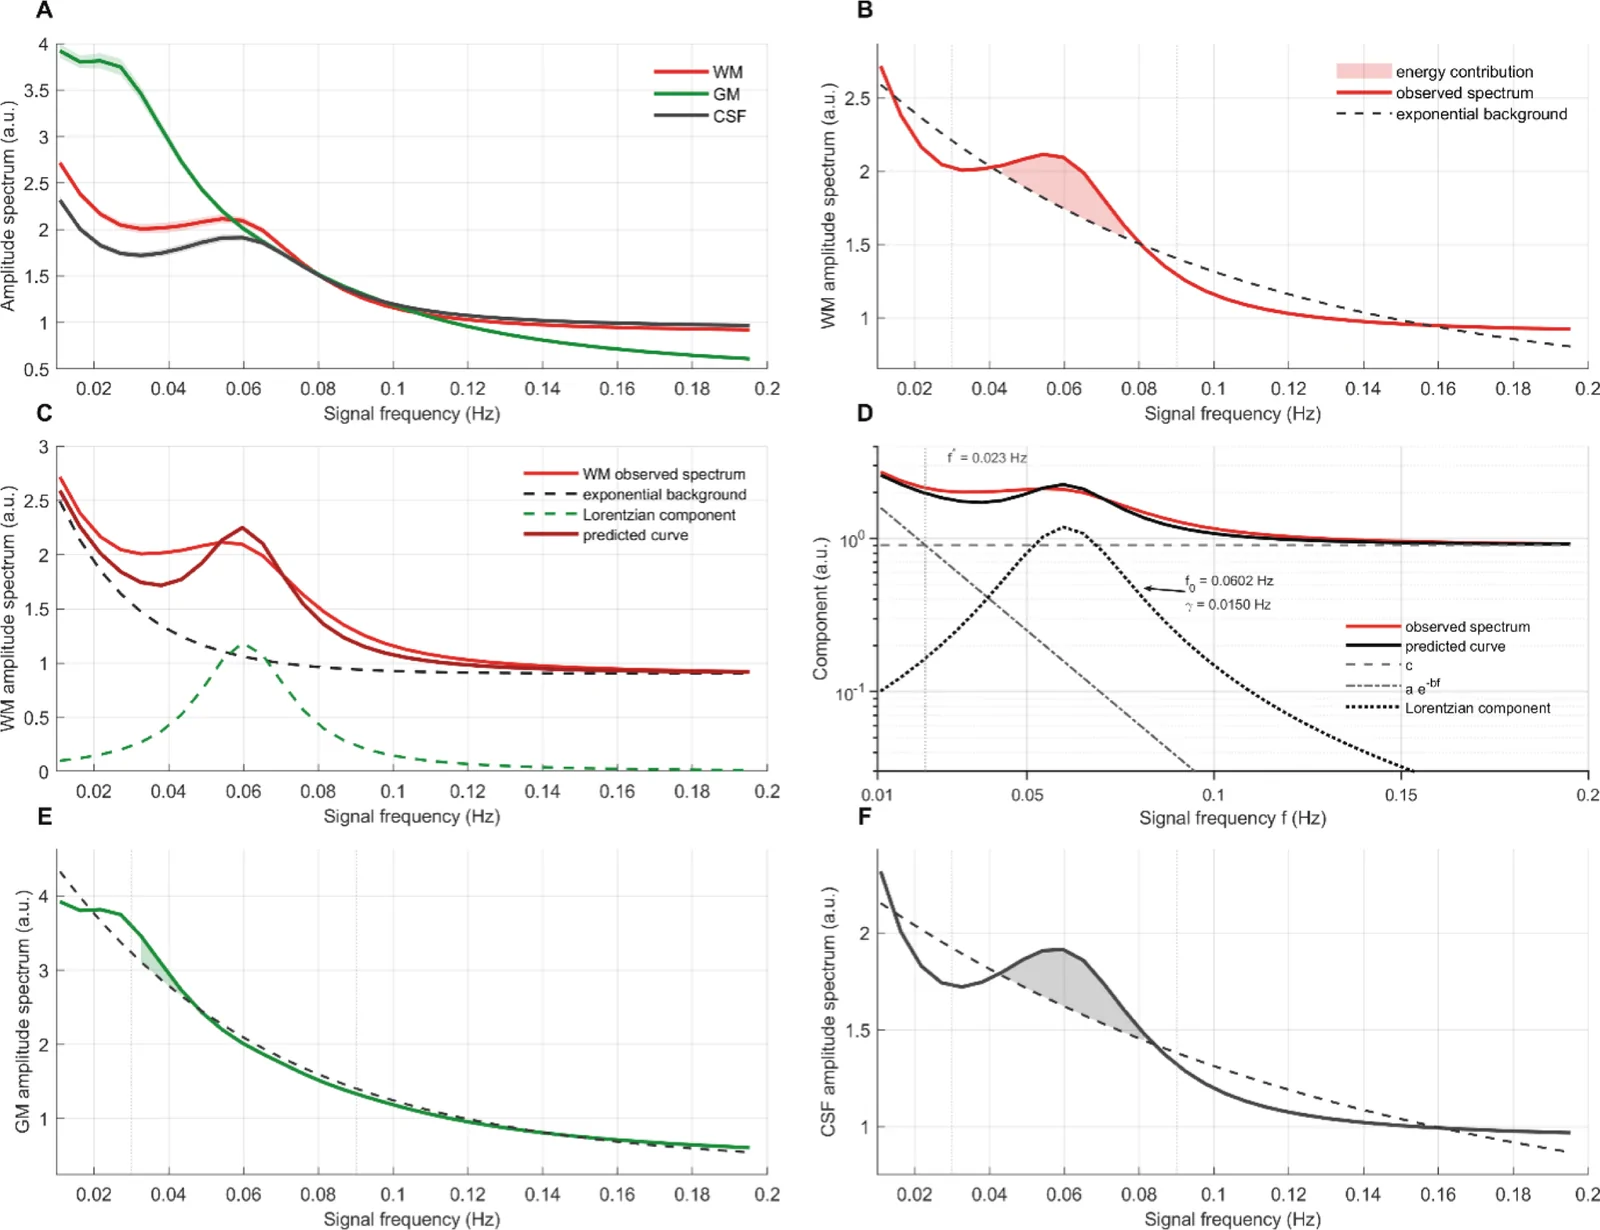
Figure 1. Tissue-specific low frequency spectra of BOLD signals and energy contributions from the second peak.
Open the figure at full size
Figure 1. Tissue-specific low frequency spectra of BOLD signals and energy contributions from the second peak.Tissue-specific low frequency spectra of BOLD signals and energy contributions from the second peak.Wu et al.
Preprint: cohort study in peopleMechanisms

Declared no competing interests

The paper

Vanderbilt University Medical Center

Research Square, 27 Aug 2026, Preprint, not peer-reviewed
doi.org/10.21203/rs.3.rs-10770821/v1PubMed 42687944