Obesity framework classifies midlife adults differently
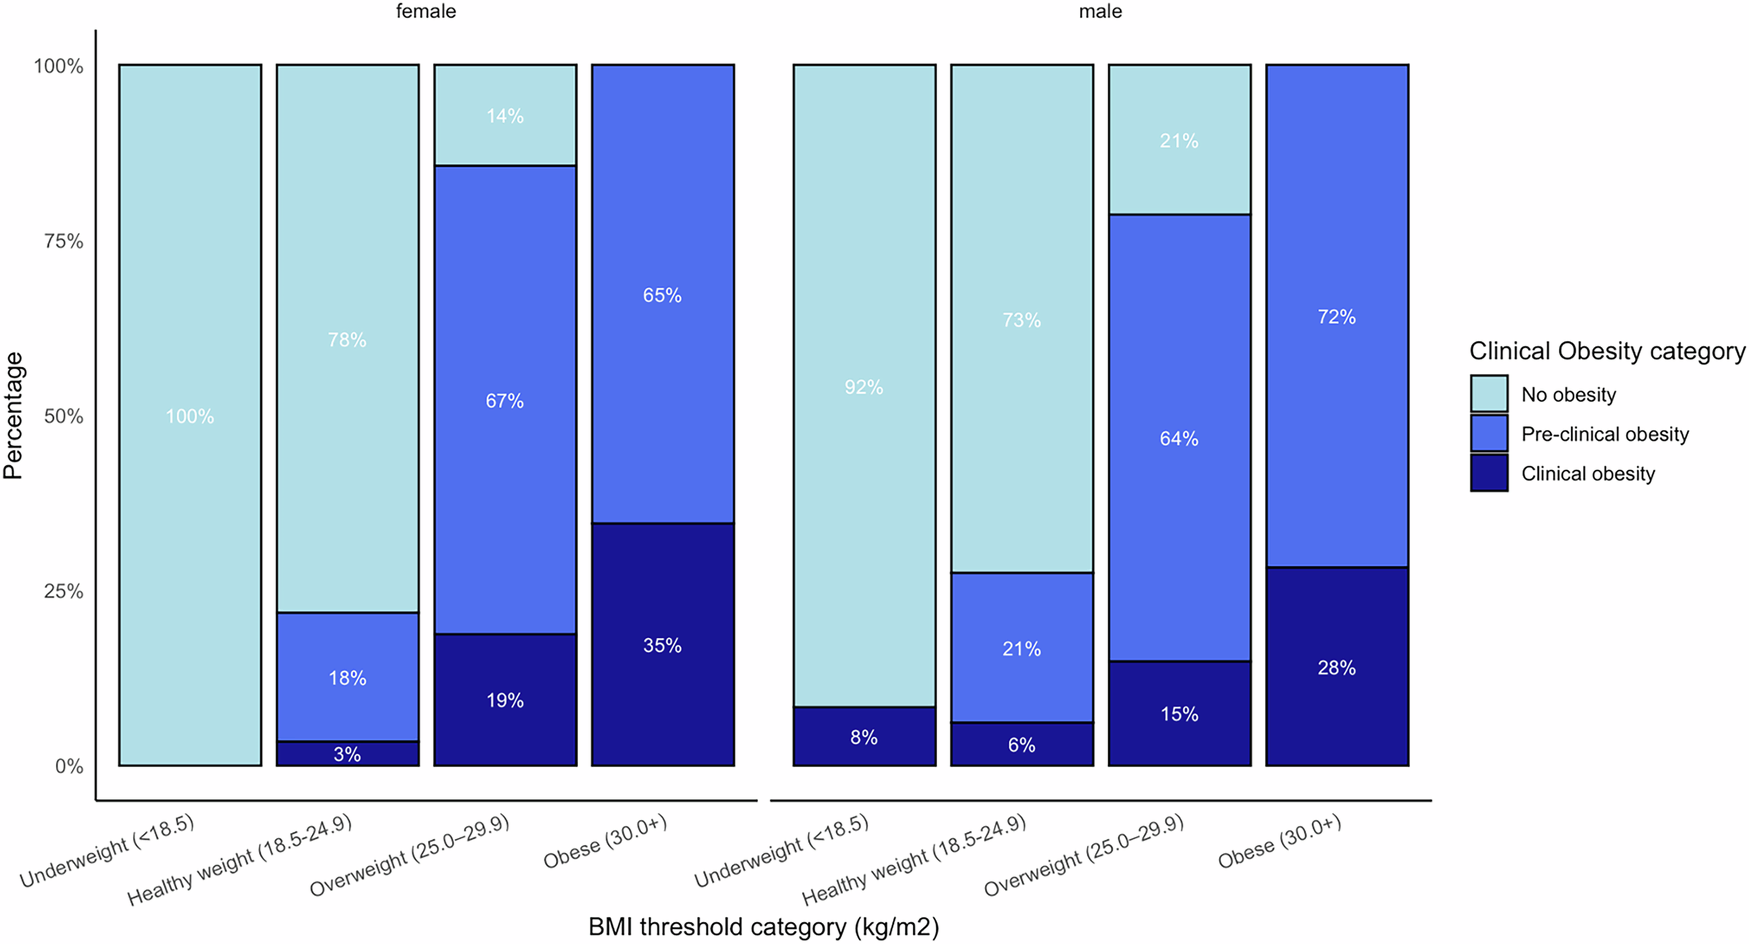
The framework classified 17.7% of adults aged 46 as having clinical obesity, versus 32.4% with obesity under body mass index categories.
Our read
Biomarkers- Studied:
- Cross-sectional study of 6,978 midlife UK adults, against the same adults classified using BMI
- What changed:
- The clinical framework classified 17.7% as clinically obese, versus 32.4% classified as obese using BMI
- The catch:
- Adults missing body composition tests had higher BMI, potentially underestimating clinical obesity prevalence
- In the record:
- The 16th paper on clinical obesity with results in people; 26 on record in all.
Editor of record: Boris Djordjevic · AgingResearch.News
Among 6,978 UK adults aged 46, 52% female, a birth cohort study compared an obesity framework with body mass index, a measure of weight relative to height. The framework defined pre-clinical obesity as excess body fat alone, and clinical obesity as excess fat with limitations in functioning or organs not working normally.
Of those classified as having obesity by body mass index, 31.4% met clinical obesity criteria; 68.6% were pre-clinical. The overweight category also included people with no obesity and clinical obesity. Over five years, 0.8% of the clinical group died, compared with 0.5% of the pre-clinical group and 0.2% of those without obesity. Clinical obesity was associated with higher odds of death in unadjusted models, while body mass index categories were not.
Why it matters
Midlife obesity assessment informs clinical care and prevention. The authors suggest that classifying obesity by its health consequences may offer a more meaningful way to assess population health risks.
Caveats
The mortality analysis involved only 27 deaths and did not account for other health or behavioral differences that might explain the link. The findings concern adults assessed at age 46.
From the paper
- Result
Compared to those with no obesity (n = 3 deaths; 0.2%), those with pre-clinical obesity (n = 15 deaths; 0.5%) or clinical obesity (n = 9 deaths; 0.8%) had 2.82 (95% CI: 0.93, 12.2) and 5.17 (1.54, 23.3) greater odds of death, respectively.
Quoted word for word from the full text on nature.com.
The paper
International Journal of Obesity, Nov 11, 2026, Open access, CC BY


Comments
Be the first to comment.