Strength and nutrition improve death risk estimates in older adults
Combining the measures improved sorting into death-risk groups, with improvement scores of 0.62 versus strength alone and 0.41 versus nutrition alone.
Dose-response
Limit: Risk groups used cutoffs optimized on the same deaths, potentially inflating prediction accuracy
Edited by Boris Djordjevic · AgingResearch.News
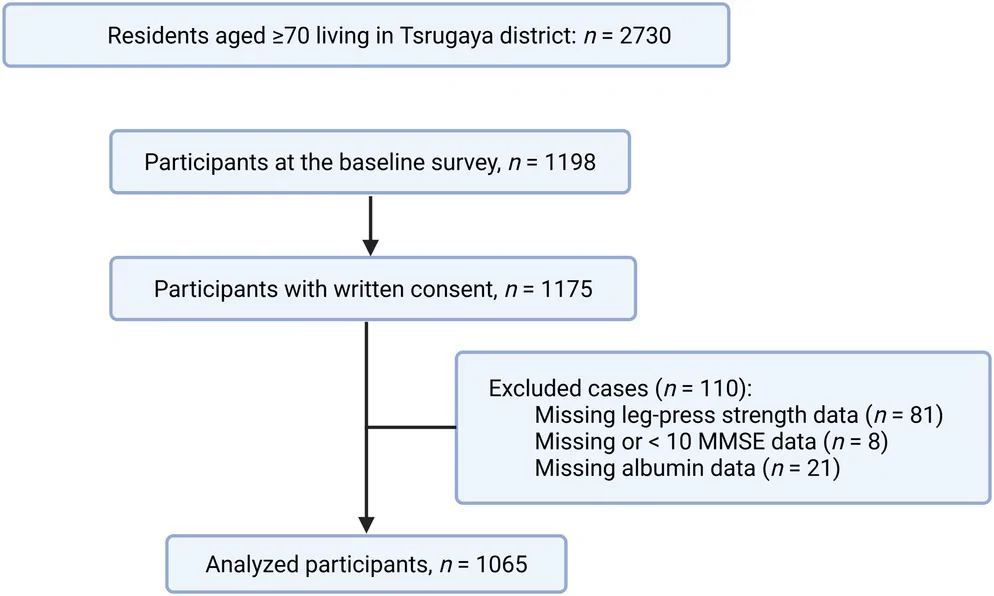
In an observational cohort study, researchers followed 1,065 community-dwelling Japanese adults aged 70 or older for 16 years. They measured leg-press strength, adjusted for body size, and calculated a nutritional score from weight, height and blood albumin, a protein. They combined the measures into four groups.
During follow-up, 415 participants died. Low strength and poor nutritional scores were each associated with higher mortality. Combining them improved prediction compared with either measure alone. At one year, mortality was 4.07% in the low-strength, poor-nutrition group and 1.19% in the high-strength, good-nutrition group. Participants with high strength but poor nutritional scores had comparable survival probabilities to those with low strength but good nutritional scores.
Why it matters
For older adults, the authors suggest that preserving muscle strength may substantially contribute to longevity alongside maintaining nutrition.
Caveats
This observational study cannot show that improving strength or nutrition extends life, and researchers selected the grouping thresholds using deaths in the same cohort. The results may not generalize beyond community-dwelling Japanese adults aged 70 or older.
From the paper
- Participants
A total of 1198 participants joined, and 1175 provided informed consent.
- Follow-up
During the 16‐year follow‐up period, a total of 415 all‐cause deaths were recorded.
- Events by group
The 1‐year mortality rates (95% CI) were 1.40% (0.58–2.22) in the high group and 2.14% (0.43–3.82) in the low group.
- Limitation
Thus, the applicability of the above data to other ethnic populations remains to be established.
Quoted word for word from the full text on PubMed Central.
The paper
Tohoku University
Journal of Cachexia, Sarcopenia and Muscle, Sep 16, 2026, Open access

Comments
Be the first to comment.