Frontiers in Digital Health

Machine learning models for chronic disease risks using complex survey data: the impact of sample weights
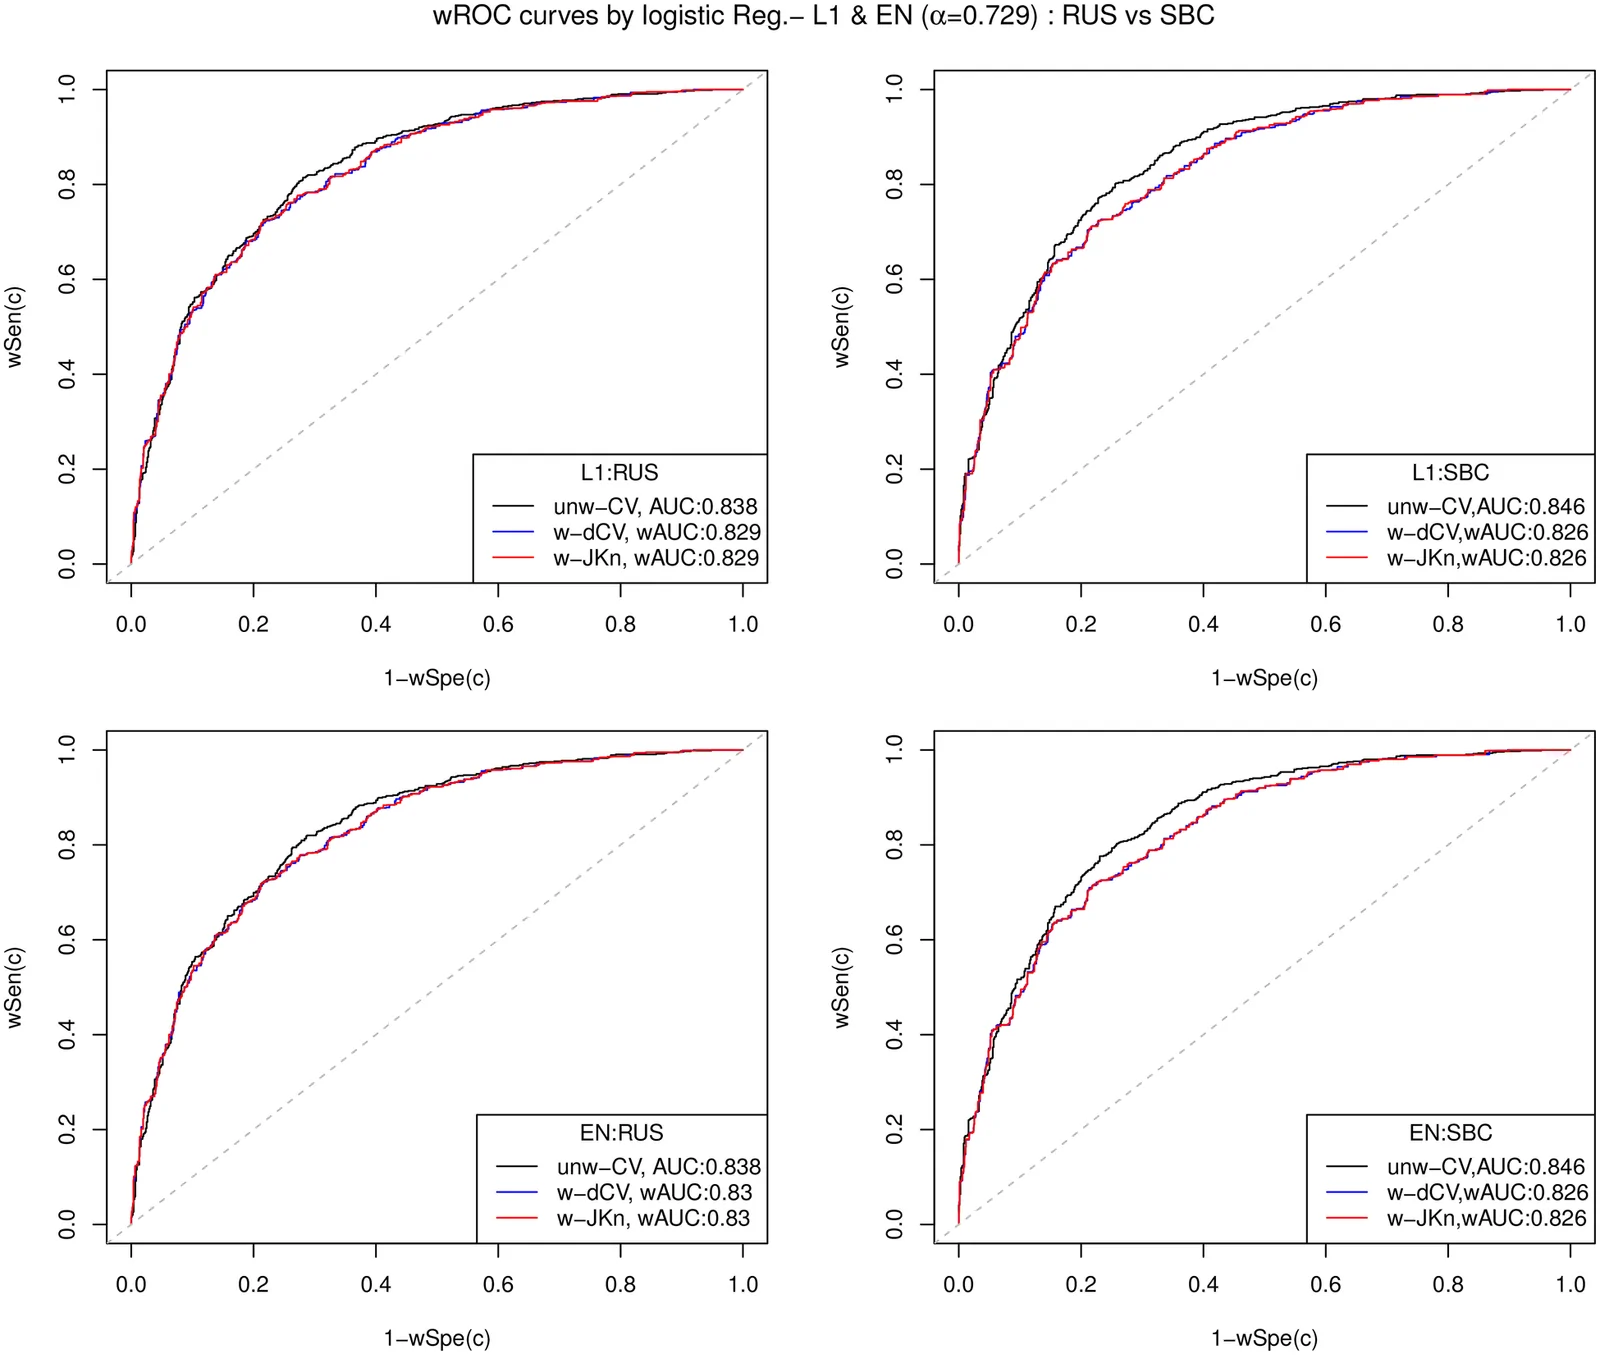
Figure 1. Hypertension: ROC and wROC curves (RUS vs. SBC) by Logistic Reg.-L1, EN (α=0.729).
Open the figure at full size
Figure 1. Hypertension: ROC and wROC curves (RUS vs. SBC) by Logistic Reg.-L1, EN (α=0.729).Hypertension: ROC and wROC curves (RUS vs. SBC) by Logistic Reg.-L1, EN (α=0.729).Kim et al.
Computational studyBiomarkers

The paper

National Center for Toxicological Research

Frontiers in Digital Health, 10 Aug 2026

doi.org/10.3389/fdgth.2026.1834715PubMed 42639427