Human genetic analysis links 30 genes to muscle-related traits
The analysis prioritized 30 genes associated with muscle-related traits, including 13 with consistent directions of association across multiple traits.
Our read
Mechanisms- Studied:
- Mendelian randomization in European-ancestry UK Biobank participants
- What changed:
- Genetically predicted expression of 30 genes was linked to muscle-related traits
- The catch:
- Single genetic instruments limited checks for effects on muscle traits through other biological pathways
- In the record:
- The 2nd paper on CCND2 with results in people; 14 on record in all.
Editor of record: Boris Djordjevic · AgingResearch.News
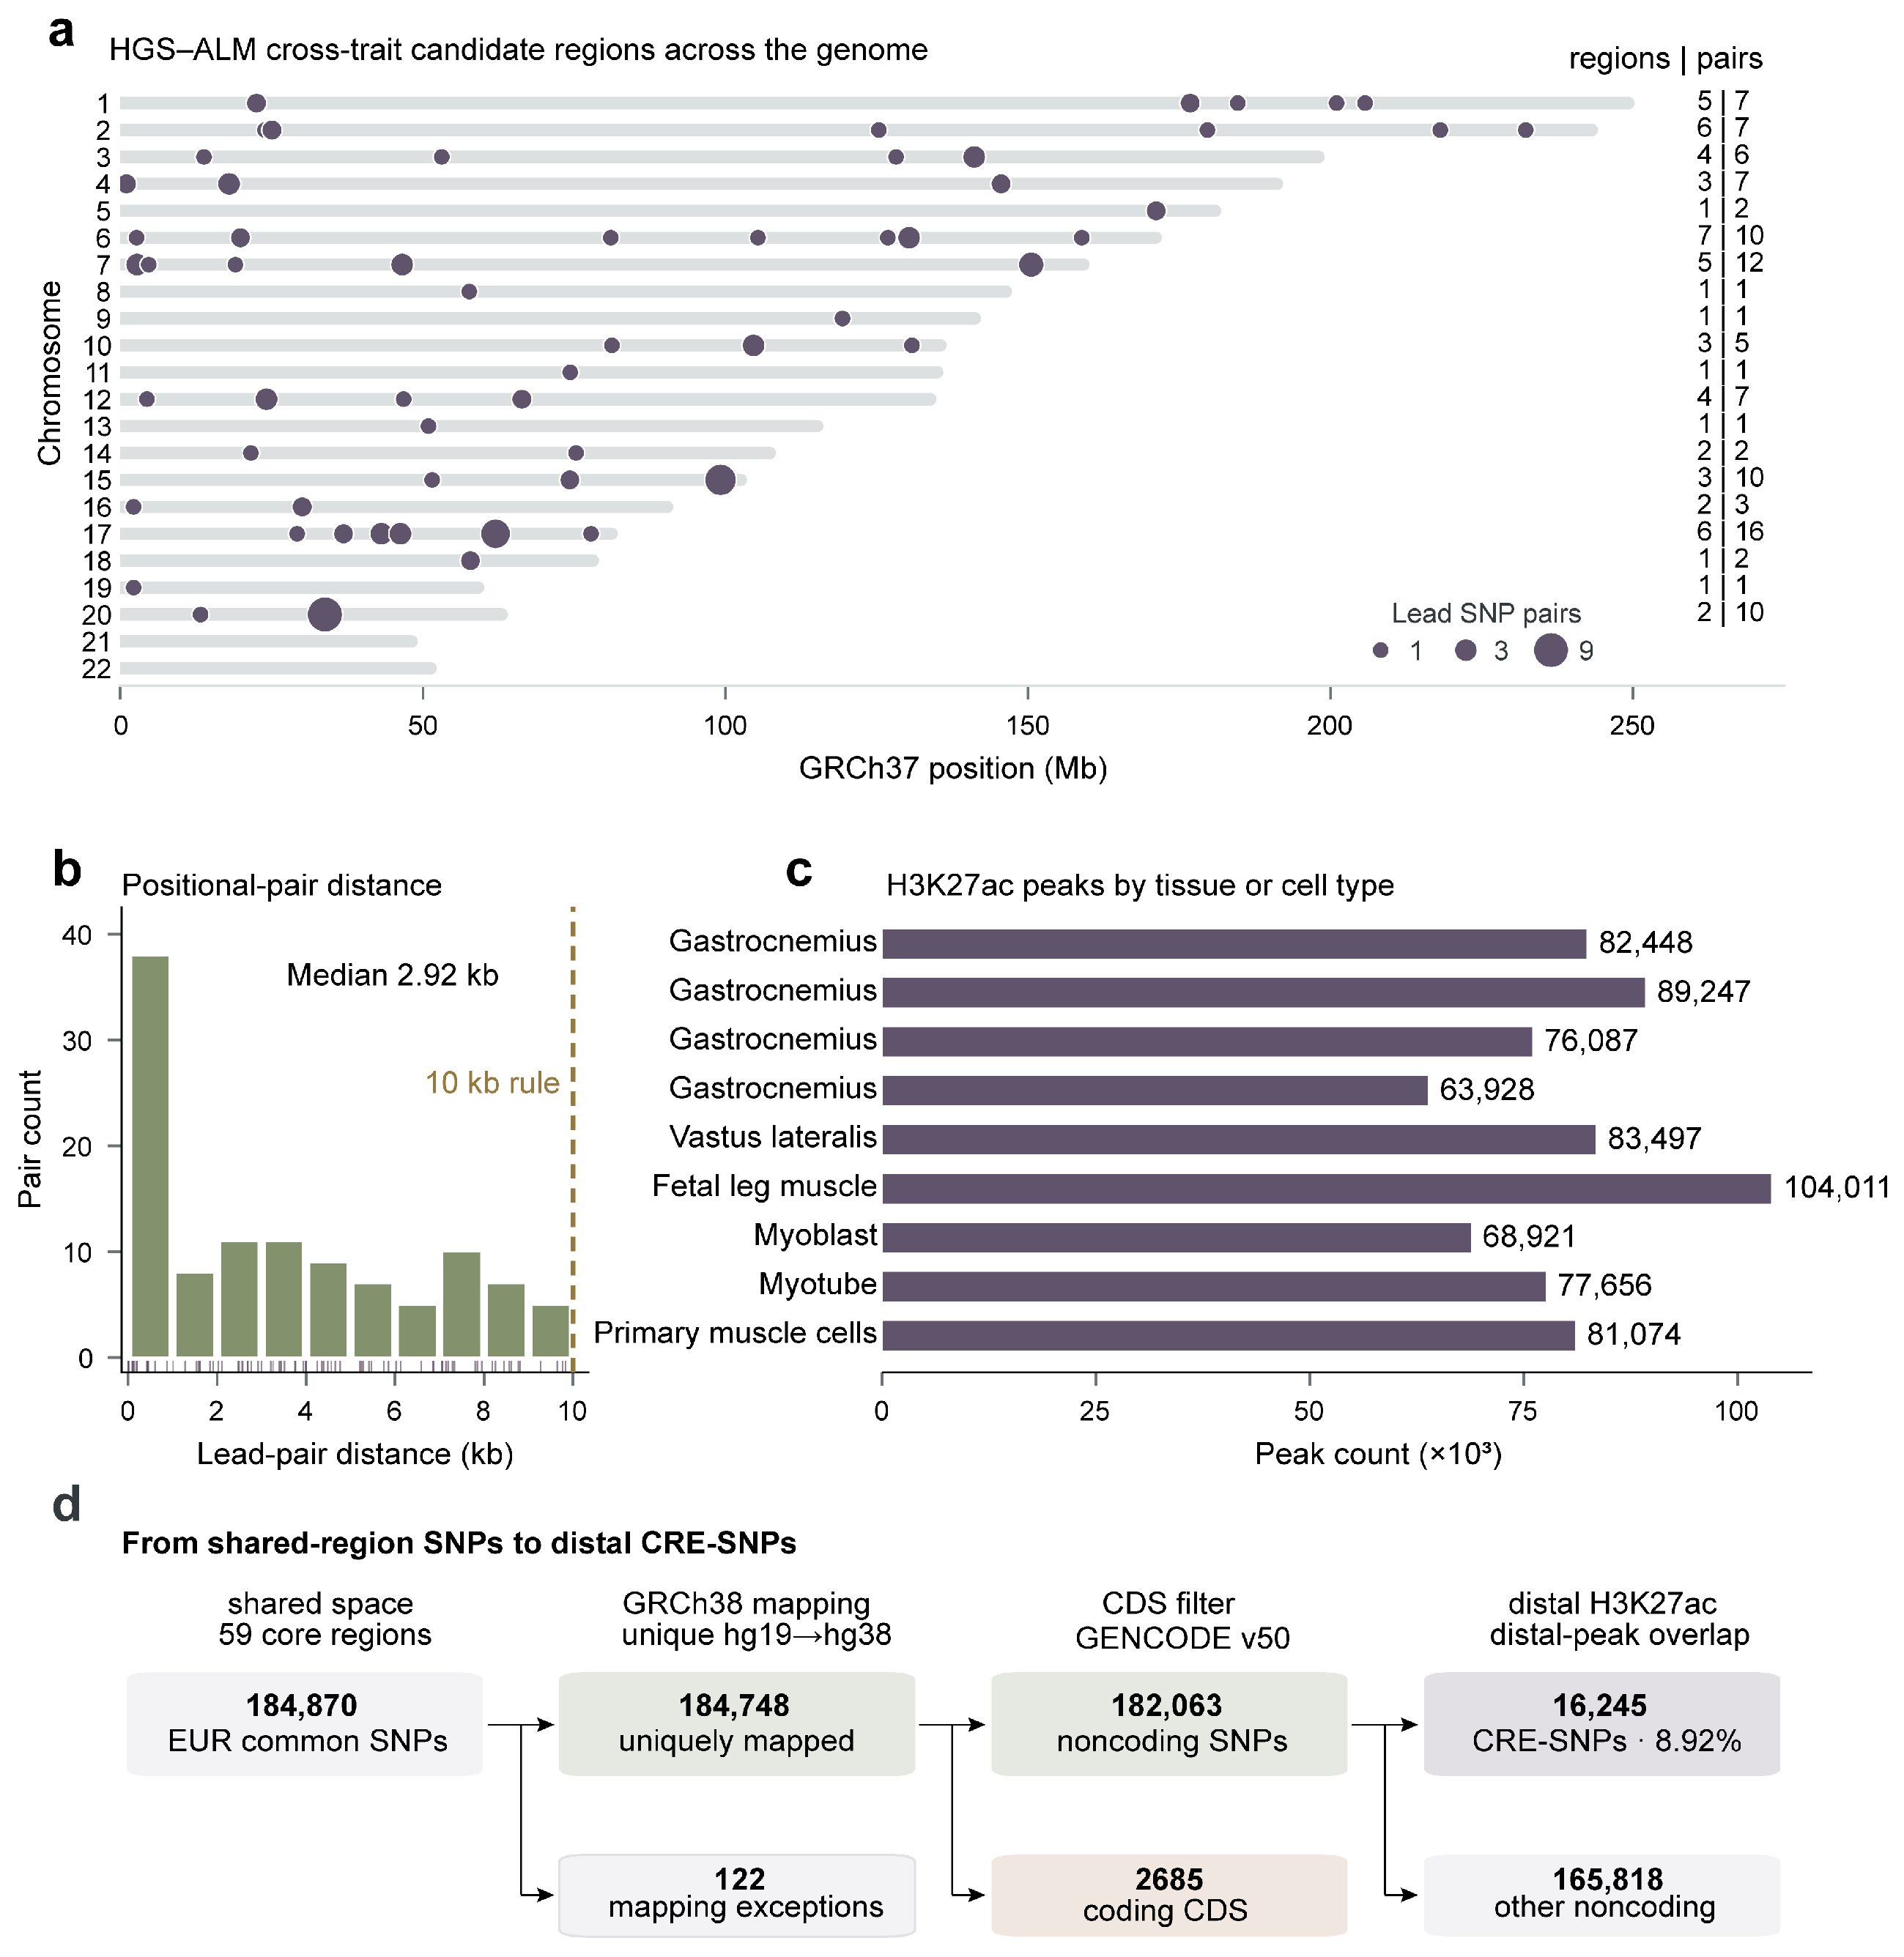
Genetic data from 406,552 UK Biobank participants of British ancestry and 450,243 of European ancestry provided the starting point for a Mendelian randomization analysis. This approach used genetic variants to examine associations between muscle gene activity and grip strength, lean tissue mass in the arms and legs, and walking pace. The researchers combined genetic studies with computer predictions and muscle gene-activity data to prioritize candidate genes.
The analysis linked 30 genes to these traits; 13 had consistent associations across multiple traits. Three genes—CCND2, HOXB3 and FGF6—also had strong support for shared genetic signals linking gene activity and muscle traits. Higher activity of the CCND2 gene was associated with more favorable muscle traits and lower type 2 diabetes risk, but higher risks of parathyroid disease and atrial fibrillation and flutter, two irregular heart rhythms.
Why it matters
Sarcopenia involves age-related losses of muscle mass, strength and physical function. The authors propose using these gene priorities to guide laboratory validation and eventual clinical applications.
Caveats
The authors note that most gene analyses relied on a single genetic variant, limiting checks for effects through other biological routes. The predominantly European-ancestry data do not establish whether the findings apply to other ancestries.
From the paper
- Participants
Outcome data came from the publicly available Lee Lab UK Biobank SAIGE binary phenotype summary statistics resource (Supplementary Table S9) [46,47,61], and only phenotypes with at least 500 cases were included.
Methods, 4.11. Phenome-Wide Mendelian Randomization (Phe-MR)
- Result
For example, higher CCND2 expression increased ALM (β = 0.2557, 95% CI: 0.2334–0.2781, q = 6.60 × 10−109) and HGS (β = 0.0596, 95% CI: 0.0420–0.0772, q = 1.51 × 10⁻⁹) and reduced LHGS risk (OR = 0.871, 95% CI: 0.794–0.955, q = 0.0354), with all three directions pointing to lower sarcopenia risk.
- Limitation
First, AlphaGenome-nominated regulatory variants and effector genes remain computational predictions, with false-positive risk that may vary with score thresholds, tissue context and prediction task [12].
Quoted word for word from the full text on mdpi.com.
- Type 2 diabetes
- Parathyroid disease
- Atrial fibrillation and flutter
- Sarcopenia
- Diverticular disease
- Humans
The paper
Chengdu Sport University; College of Animal Science and Technology
International Journal of Molecular Sciences, Nov 15, 2026, Open access, CC BY

Comments
Be the first to comment.