Muscle-related genetic score linked to lower liver disease odds
Higher genetic scores were linked to lower odds of nonalcoholic fatty liver disease, with an odds ratio of 0.97 compared with lower scores.
Our read
Biomarkers- Studied:
- Study in people
Editor of record: Boris Djordjevic · AgingResearch.News
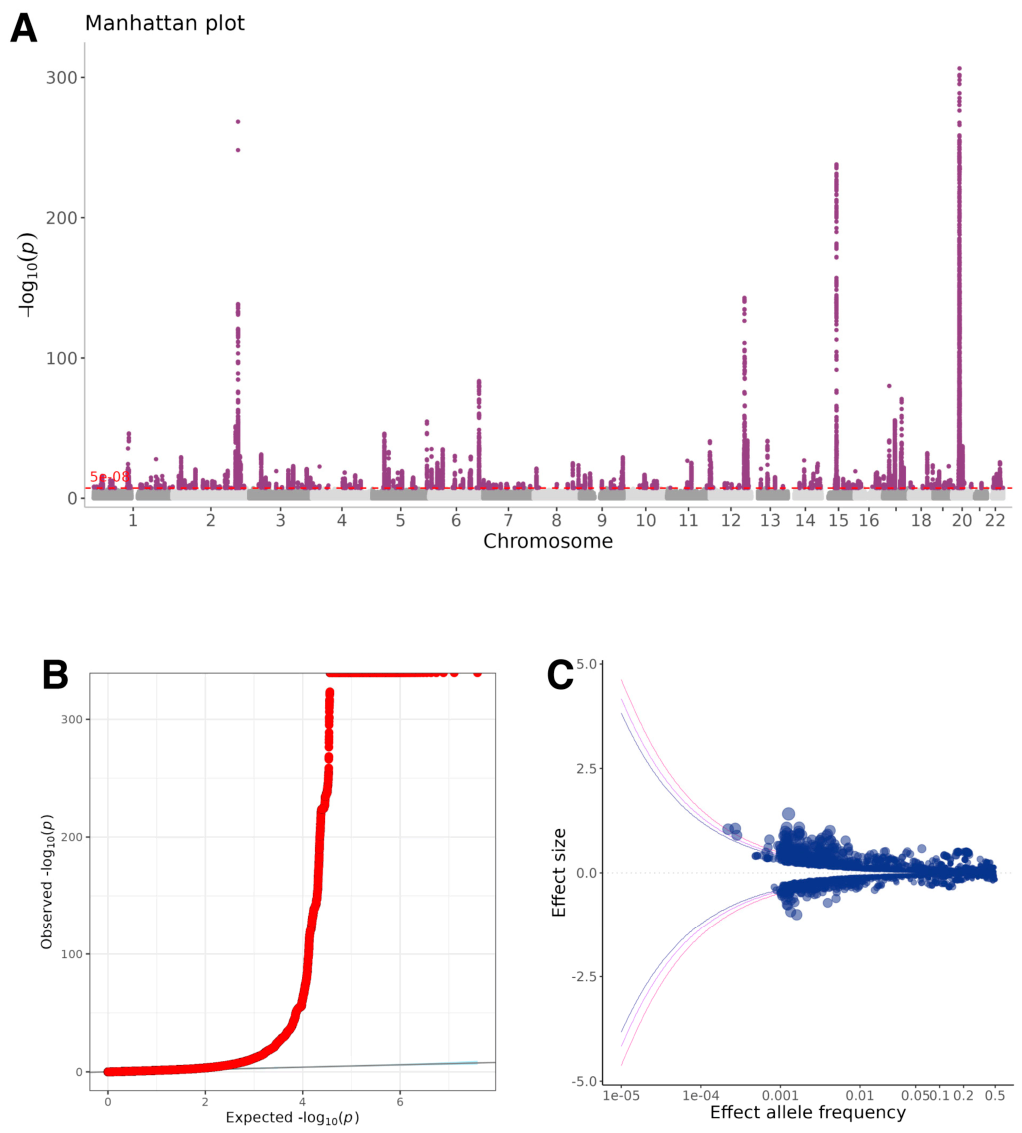
UK Biobank participants of European ancestry—389,804 people from a cohort recruited at ages 40–69—were included in an observational genetic study. It examined the sarcopenia index, a muscle-related measure calculated from two blood tests. The researchers identified 2,476 genetic variants associated with the index, near or within 406 genes. They combined genetic variants into a score reflecting a tendency toward a higher index.
Higher scores were associated with lower odds of nonalcoholic fatty liver disease, fatty liver linked to metabolic problems, liver scarring, end-stage liver disease and liver cancer. For liver cancer, the range of likely values included no difference. No clear association emerged for alcohol-related liver disease. Additional analyses using inherited genetic differences also linked a higher index to lower risks of nonalcoholic fatty liver disease and liver scarring.
Why it matters
Progressive loss of muscle mass and strength is a concern in aging. The authors suggested that these genetic links could help identify people at greater risk of liver disease.
Caveats
A genetic score for a blood-based muscle proxy does not show whether increasing muscle mass or strength would lower liver disease odds. The European-ancestry sample limits how readily the findings apply to other ancestry groups.
From the paper
- Participants
GWAS analyses were performed based on data from a total of 389,804 individuals of European ancestry (Table 1, Figure 1A–C).
- Result
… MR analyses employing the inverse-variance weighted method supported a causal relationship in which genetic predisposition to elevated SI resulted in reduced risks of NAFLD (OR = 0.752 [95% CI 0.577, 0.979], p = 0.034) and liver fibrosis (OR = 0.745 [95% CI 0.632, 0.877], p = 3.68 × 10⁻⁴).
Results, 3.3. LD Score Regression and Mendelian Randomization
- Limitation
Accordingly, our results should be regarded as associations with the SI phenotype rather than direct evidence for clinically diagnosed sarcopenia, as defined by AWGS 2019/EWGSOP2.
Quoted word for word from the full text on mdpi.com.
The paper
Sir Run Run Shaw Hospital
Biomedicines, Nov 8, 2026, Open access, CC BY
Comments
Be the first to comment.