A Machine Learning-Derived Risk Scorecard for Pneumonia Hospitalization in Japanese Old-Old Adults
Independent replication, declared no competing interests
Abstract
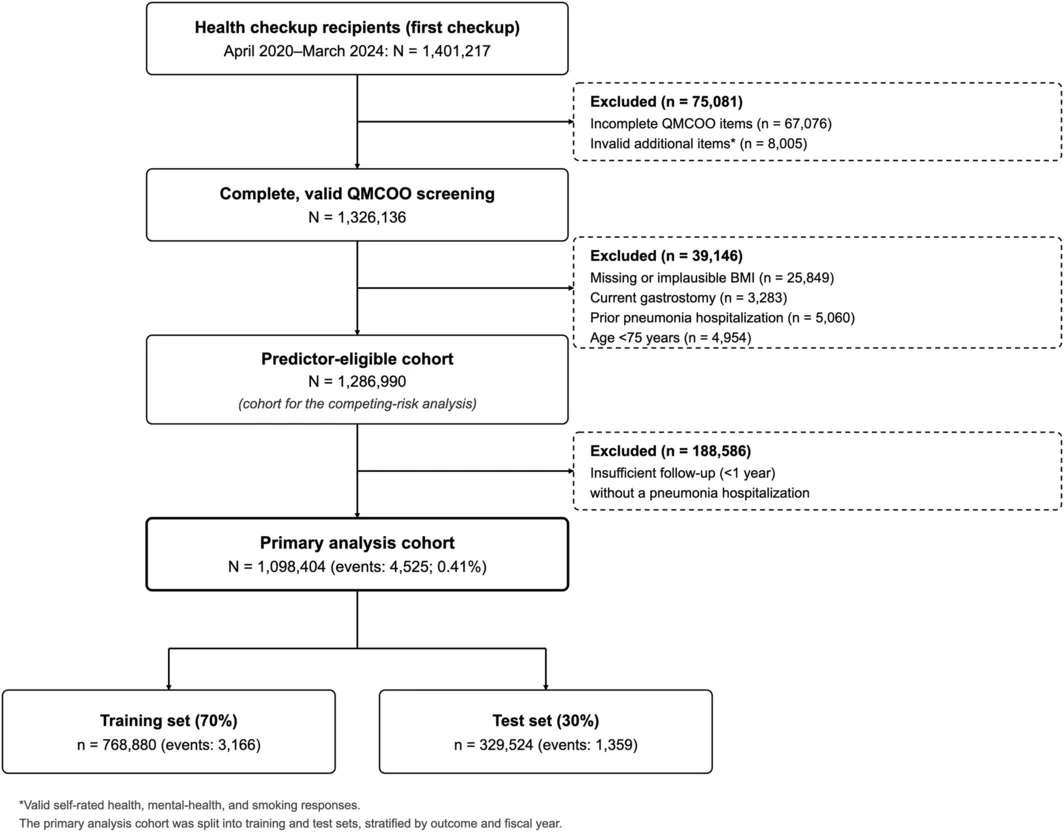
AIM: To develop and internally validate a machine learning-based risk scorecard for 1-year pneumonia hospitalization among community-dwelling Japanese adults aged ≥ 75 years using routinely collected frailty screening and claims data. METHODS: We conducted a retrospective cohort study of 1 098 404 community-dwelling adults aged ≥ 75 years who completed the Questionnaire for Medical Checkup of Old-Old (QMCOO) between April 2020 and March 2024, using the Late-Stage Medical Care System claims database. Data were split into training (70%) and test (30%) sets. A Super Learner ensemble of 20 base learners was developed to predict 1-year pneumonia hospitalization (ICD-10: J12-J18, J69). An independent 17-feature point-based scorecard (0-21 points) was derived from the training set with Platt calibration. Performance was evaluated by the area under the receiver operating characteristic curve (AUC), calibration slope, and calibration-in-the-large. RESULTS: Among 1 098 404 participants (mean age 80.6 [SD 5.0] years; 40.3% male), 4525 (0.41%) experienced pneumonia hospitalization. On the test set, the Super Learner achieved an AUC of 0.823 (95% CI, 0.812-0.834) and the scorecard 0.786 (0.774-0.798), which showed good calibration (slope 1.017; calibration-in-the-large -0.001). Stratification into low (0-6 points; 55.6%, 0.12% event rate), moderate (7-10; 35.4%, 0.49%), and high (≥ 11; 9.0%, 1.91%) groups yielded a 15.9-fold risk gradient. CONCLUSIONS: A QMCOO-based risk scorecard showed good discrimination and calibration for predicting 1-year pneumonia hospitalization in this population. If externally validated, this tool may help identify high-risk individuals during routine health checkups and support targeted preventive assessment in primary care.
From the paper
- Participants
A total of 1 098 404 individuals met the inclusion criteria.
- Result
The Aalen–Johansen pneumonia incidence was 0.378% (95% CI, 0.367–0.389), differing by 0.003 percentage points from the complement of the Kaplan–Meier estimate (0.381%; 0.370–0.392).
- Limitation
Health checkup attendees may be healthier than non‐attendees, limiting generalizability to frailer or homebound populations.
Quoted word for word from the full text on PubMed Central.
The paper
Mie University Hospital
Geriatrics & Gerontology International, 24 Sep 2026